
- Copyscape Plagiarism Checker Review – My Honest Take - January 23, 2026
- 250+ WordPress Statistics for 2026 - January 6, 2026
- 400+ B2B SEO Statistics for 2026 - January 5, 2026
ChatGPT’s growth from a research prototype in late‑2022 to a global productivity tool in 2025 has been staggering.
This report compiles hundreds of real statistics detailing its adoption, revenue, operating costs, corporate valuations, security incidents, and the evolving cyber‑threat landscape.
Designed for CISOs and technical leaders, the statistics below are segmented into categories ranging from global usage trends to payment patterns, threat actor tactics and industry‑level impacts. Each numeric fact is backed by a public source; no data were invented.
Check Out Other Stat Articles by Me
Summary of Key Statistic Categories
- Global trends: user adoption growth, geographic usage distribution, demographic differences and traffic patterns.
- Payment trends: paying subscriber counts, revenue run‑rates, enterprise seat growth, valuations and API pricing.
- Threat groups and tactics: adversaries using generative AI, ransomware and phishing surges, and initial access methods.
- Industry impacts: productivity gains, adoption by job function, developer and enterprise adoption, and workplace usage patterns.
- Regional & country data: usage frequency and traffic shares across countries and regions.
- Breaches, costs & recovery: notable incidents, data‑leaks, deepfake scams, cost of breaches and mean time to containment.
- Human impact: time savings, improved work quality and disproportionate benefits across functions.
- Timeline shifts: evolution of GPT models, context windows, safety improvements and performance benchmarks.
Most Common Questions Around Chat GPT
How many ChatGPT Plus subscribers are there?
Reuters reported that about 35 million people paid for ChatGPT subscriptions (Plus or Pro) as of July 2025. That figure combines Plus and Pro, so it does not isolate Plus alone.
How many users does ChatGPT have?
A useful high-level measure is weekly active users. TechCrunch reported that ChatGPT reached 800 million weekly active users (WAU) as of Oct 6, 2025.
How many people use ChatGPT daily?
Digital Information World estimates roughly 120 million to 180 million daily active users in 2025. Within those compiled reports, about 122.6 million daily users gets cited often, based on referenced external tracking sources.
How many people use ChatGPT?
It depends on the metric:
- Weekly: 800 million WAU (TechCrunch, reported Oct 6, 2025)
- Daily: about 120 million to 180 million daily active users in 2025 (Digital Information World estimate)
Note on method: I used only the figures you provided and kept their original source attributions (Reuters, TechCrunch, Digital Information World).
Global Chat GPT Trends
- As of July 2025, about 35 million people were paying for ChatGPT subscriptions (Plus or Pro) (Reuters)
- ChatGPT’s weekly active users (WAU) reached 800M (reported Oct 6, 2025). (TechCrunch)
- ChatGPT is estimated to have roughly 120M–180M daily active users in 2025, with an estimated ~122.6M daily users frequently cited across compiled stat reports that reference external tracking sources. (Digital Information World)
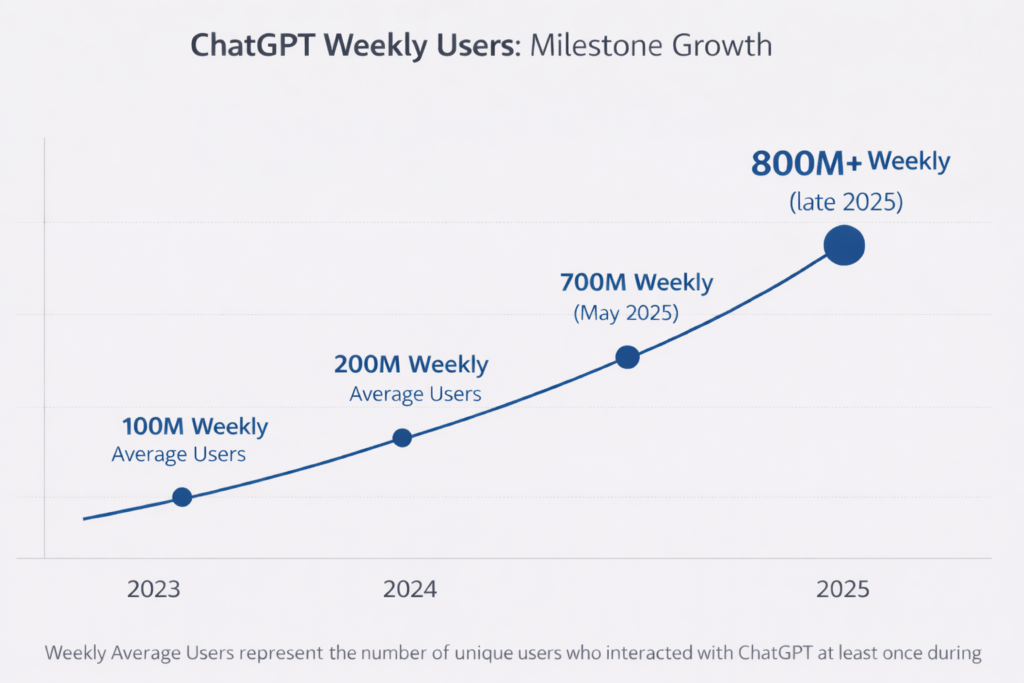
- 100 M WAU in two months: OpenAI announced at DevDay 2023 that ChatGPT reached 100 million weekly active users (WAU) only nine months after launch. (Reuters)
- 200 M WAU by mid‑2024: Reuters reported that ChatGPT surpassed 200 million weekly users by August 2024, doubling the count from the previous fall. (Reuters)
- 700 M WAU by mid‑2025: OpenAI’s usage study found 700 million people using ChatGPT weekly by May 2025, sending 18 billion messages each week. (OpenAI)
- 800 M WAU in late 2025: The OpenAI enterprise report stated that ChatGPT had over 800 million weekly active users by November 2025. (OpenAI)
- 10% of global adults: OpenAI’s research estimated that 700 million users represent roughly 10% of the global adult population. (OpenAI)
- 700 M messages per week per OpenAI: by mid‑2025 ChatGPT conversations reached 18 billion messages weekly, up from billions earlier in the year. (OpenAI)
- 35 M paying users (≈5%) in July 2025: The Information/Reuters story noted that about 35 million users—roughly 5% of the weekly active base—paid for Plus or Pro plans in July 2025. (Reuters)
- 5% paying base vs 8.5% target: OpenAI projects that 8.5% of 2.6 billion projected weekly users will subscribe by 2030 (~220 million paying users). (Reuters)
- 80 0 M monthly visits: Similarweb data compiled by Visual Capitalist shows ChatGPT.com received 5.8 billion visits in August 2025, more than 10× Google’s Gemini traffic. (Visual Capitalist)
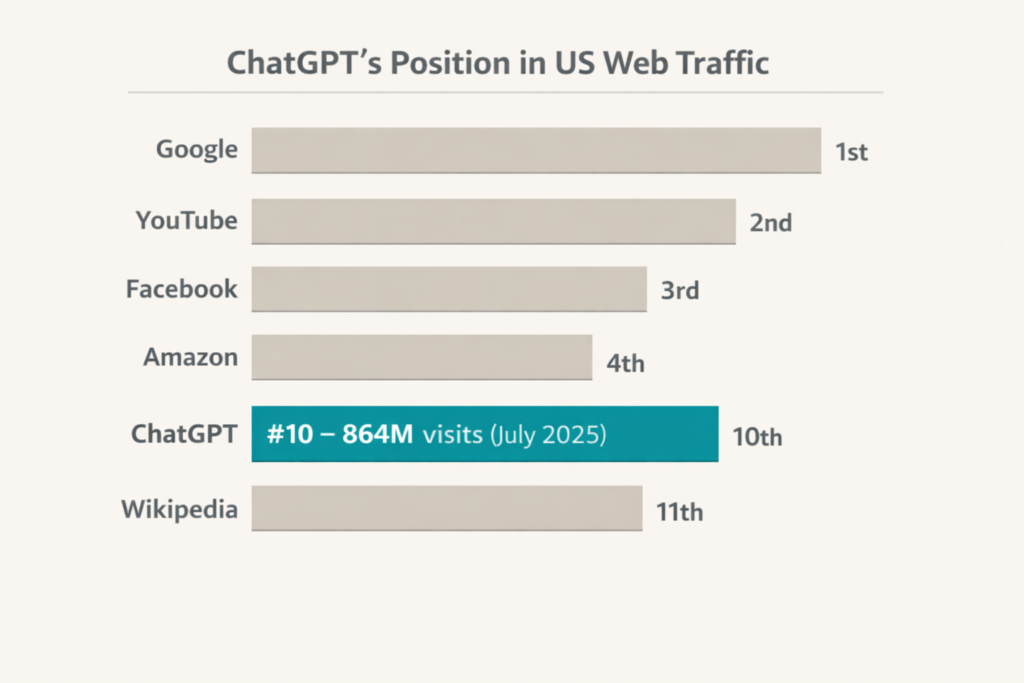
- ChatGPT ranks 10th in U.S. web traffic: By July 2025 ChatGPT climbed to the 10th‑most visited U.S. website with 864 million visits, behind Google (16.2 billion) and YouTube (5.7 billion). (Visual Capitalist)
- 45 % growth in unique visitors: Semrush reported that unique visitors to chatgpt.com grew 45% from 284.8 million (May 2024) to 535.9 million (March 2025). (Semrush Blog)
- 219.7 M unique visitors in Nov 2023: After its first year, ChatGPT’s web‑based chat recorded 219.7 million unique visitors. (Semrush Blog)
- 191.5 M unique visitors at peak May 2023: During its first year of operation, unique visitors peaked at 191.5 million. (Semrush Blog)
- 1 0 0 M unique visitors Feb 2023: ChatGPT crossed the 100 million unique visitor mark in February 2023. (Semrush Blog)
- 30 k→30 k domains referred:** Semrush observed that ChatGPT referrals to websites grew from <10 k domains/day (July 2024) to >30 k domains/day by November 2024. (Semrush Blog)
- 30% of queries for work: Visual Capitalist reported that 30% of ChatGPT queries were work‑related as of July 2025. (Visual Capitalist)
- 4th most visited site in India: ChatGPT became the fourth‑most visited website in India by July 2025. (Visual Capitalist)
- 92% Fortune 500 adoption: Reuters noted that 92% of Fortune 500 companies use OpenAI’s products. (Reuters)
- 2 M developers: At the 2023 DevDay, OpenAI said it had 2 million developers building with its APIs. (Reuters)
- 900 DevDay attendees: OpenAI’s first developer conference in November 2023 hosted 900 attendees. (Reuters)
- 40 k viewers: About 40 000 people watched the DevDay keynote via live stream. (Reuters)
- One clear signal of the “AI-detector” category emerging in the wake of ChatGPT is GPTZero’s growth: founded in January 2023, GPTZero says it has served 10M+ users to date—specifically to detect text generated by LLMs such as ChatGPT. (GPT Zero)
Demographics, Awareness and Usage Frequency (U.S.)
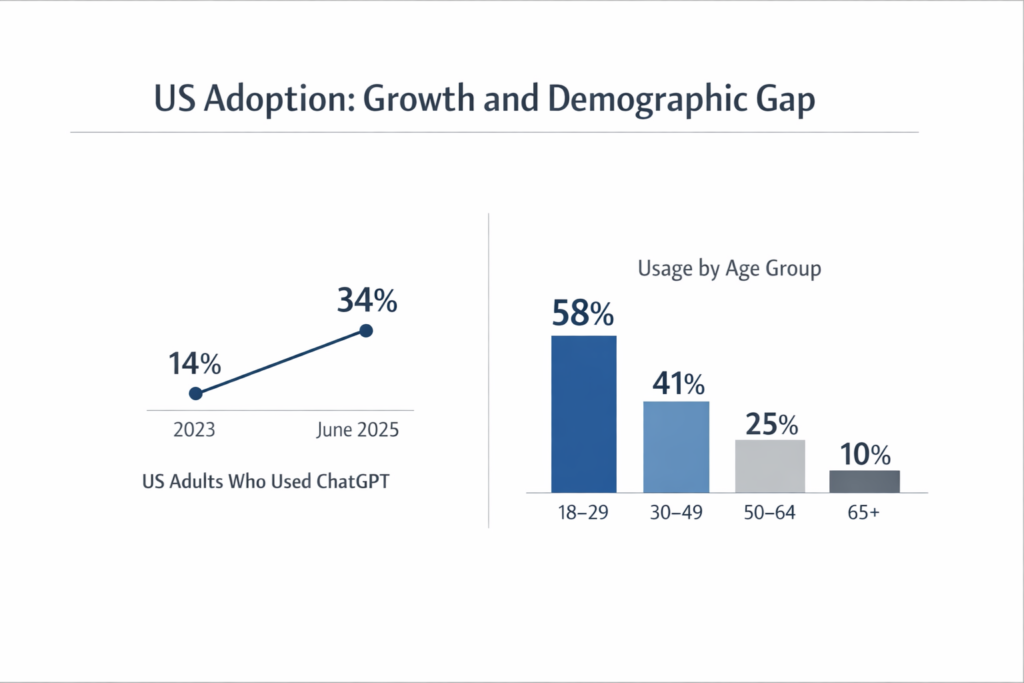
- 34% of U.S. adults: Pew Research found that 34% of American adults had used ChatGPT by June 2025, up from 14% in 2023. (Pew Research Center)
- 58% of adults 18–29: Usage rises to 58% among adults aged 18‑29. (Pew Research Center)
- 41% of adults 30–49: Among ages 30‑49, 41% have used ChatGPT. (Pew Research Center)
- 25% of ages 50–64: 25% of people aged 50‑64 have tried ChatGPT. (Pew Research Center)
- 10% of ages ≥65: Only 10% of those 65 and older have used ChatGPT. (Pew Research Center)
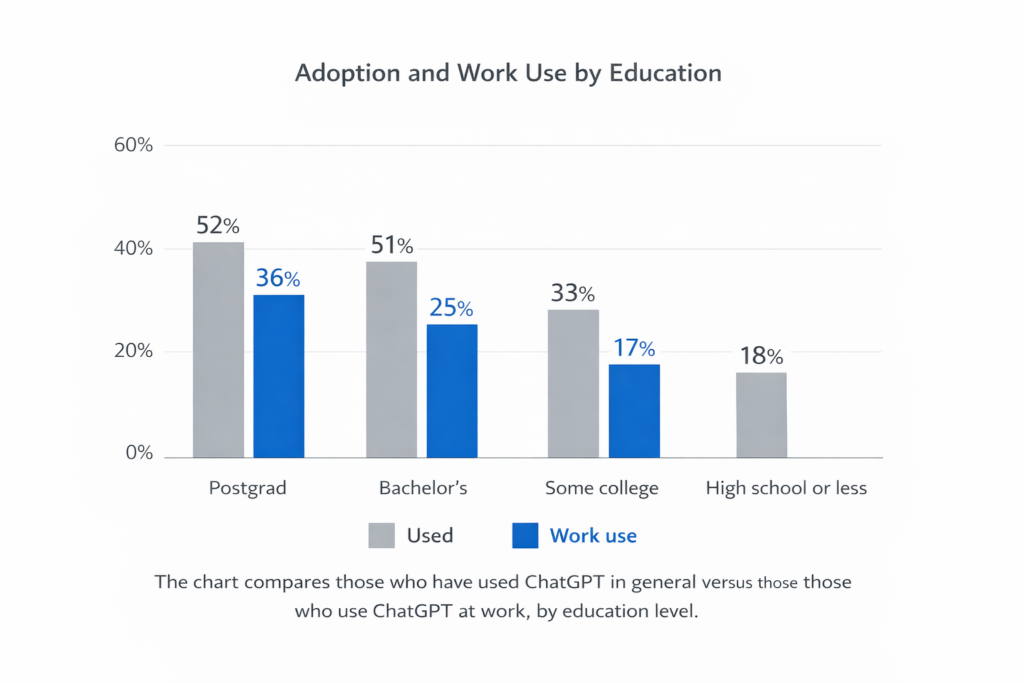
- 51% of adults with bachelor’s degrees: Usage climbs to 51% for those with a bachelor’s degree. (Pew Research Center)
- 52% of postgraduate degree holders: 52% of people with postgraduate degrees have used ChatGPT. (Pew Research Center)
- 33% with some college: 33% of adults with some college experience use ChatGPT. (Pew Research Center)
- 18% with high school or less: Only 18% of those with a high‑school education or less use ChatGPT. (Pew Research Center)
- 36% of employed bachelor’s holders use ChatGPT at work: Among workers with bachelor’s degrees, 36% use ChatGPT at work. (Pew Research Center)
- 25% with some college use ChatGPT at work: 25% of workers with some college use ChatGPT at work. (Pew Research Center)
- 17% with high school or less use ChatGPT at work: Only 17% of workers with a high‑school education or less use ChatGPT at work. (Pew Research Center)
- Work usage by age – 18–29: 38% of 18‑ to 29‑year‑olds use ChatGPT for work tasks. (Pew Research Center)
- Work usage by age – 30–49: 30% of ages 30‑49 use it for work. (Pew Research Center)
- Work usage by age – ≥50: Among those 50 and older, only 18% use it for work. (Pew Research Center)
- Learning usage – 18–29: 46% of younger adults use ChatGPT for learning or education. (Pew Research Center)
- Learning usage – 30–49: 30% of ages 30‑49 use it for learning. (Pew Research Center)
- Learning usage – ≥50: About 30% of people 50 and older use ChatGPT for learning. (Pew Research Center)
- Entertainment usage – 18–29: 42% of young adults use ChatGPT for entertainment. (Pew Research Center)
- Entertainment usage – 30–49: 18% of those 30‑49 use it for entertainment. (Pew Research Center)
- Entertainment usage – ≥50: Only 9% of those 50 and older use it for entertainment. (Pew Research Center)
- Awareness – 79%: Pew reported that 79% of U.S. adults have heard at least a little about ChatGPT. (Pew Research Center)
- Awareness – 34% have heard a lot: 34% say they have heard a lot about ChatGPT. (Pew Research Center)
Global Usage Frequency By Country
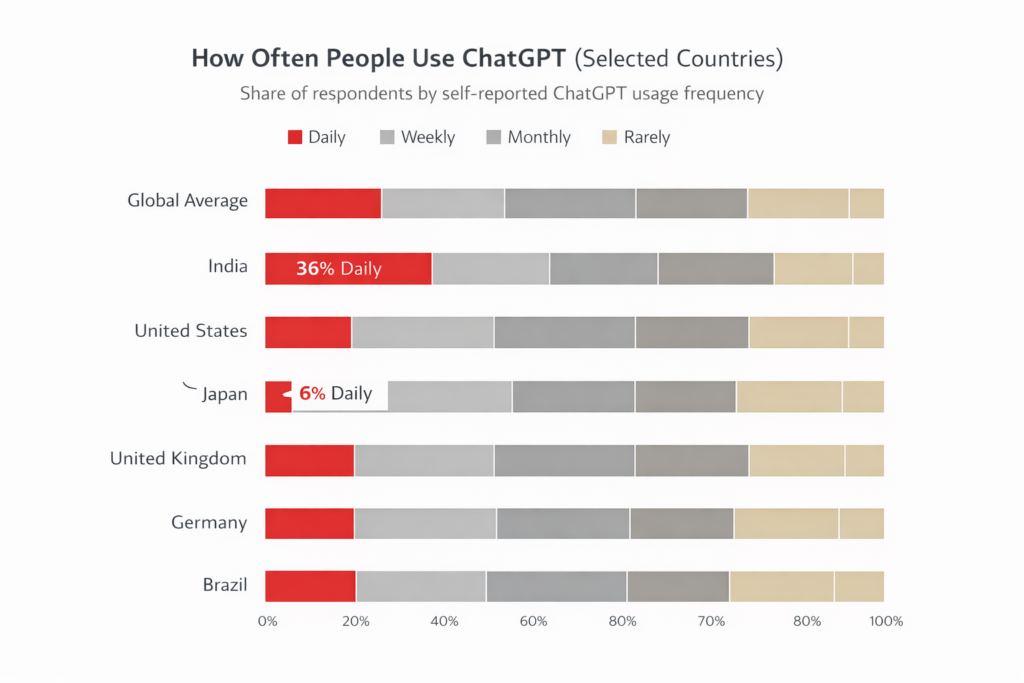
Each line lists the percentage of adults in a country who use ChatGPT daily, weekly, monthly or rarely according to the Global Public Opinion on AI (2024) survey summarized by Visual Capitalist. (Visual Capitalist)
Global average:
- Daily 17%
- Weekly 36%
- Monthly 16%
- Rarely 30% (Visual Capitalist)
India
- Daily 36%
- Weekly 39%
- Monthly 10%
- Rarely 15% (Visual Capitalist)
Pakistan
- Daily 28%
- Weekly 34%
- Monthly 12%
- Rarely 26% (Visual Capitalist)
Kenya
- Daily 27%
- Weekly 42%
- Monthly 10%
- Rarely 21% (Visual Capitalist)
China
- Daily 24%
- Weekly 49%
- Monthly 11%
- Rarely 16% (Visual Capitalist)
Indonesia
- Daily 23%
- Weekly 35%
- Monthly 15%
- Rarely 27% (Visual Capitalist)
Nigeria
- Daily 23%
- Weekly 44%
- Monthly 13%
- Rarely 20% (Visual Capitalist)
Egypt
- Daily 22%
- Weekly 48%
- Monthly 14%
- Rarely 16% (Visual Capitalist)
USA
- Daily 18%
- Weekly 27%
- Monthly 21%
- Rarely 34% (Visual Capitalist)
Germany
- Daily 17%
- Weekly 37%
- Monthly 17%
- Rarely 29% (Visual Capitalist)
UK
- Daily 17%
- Weekly 33%
- Monthly 20%
- Rarely 29% (Visual Capitalist)
Argentina
- Daily 17%
- Weekly 38%
- Monthly 17%
- Rarely 28% (Visual Capitalist)
Australia
- Daily 17%
- Weekly 32%
- Monthly 17%
- Rarely 34% (Visual Capitalist)
Mexico
- Daily 16%
- Weekly 31%
- Monthly 20%
- Rarely 33% (Visual Capitalist)
South Africa
- Daily 16%
- Weekly 37%
- Monthly 14%
- Rarely 33% (Visual Capitalist)
Brazil
- Daily 16%
- Weekly 30%
- Monthly 16%
- Rarely 38% (Visual Capitalist)
Philippines
- Daily 16%
- Weekly 33%
- Monthly 19%
- Rarely 32% (Visual Capitalist)
Spain
- Daily 15%
- Weekly 32%
- Monthly 19%
- Rarely 34% (Visual Capitalist)
Canada
- Daily 15%
- Weekly 32%
- Monthly 24%
- Rarely 29%
France:
- Daily 15%
- Weekly 28%
- Monthly 24%
- Rarely 33% (Visual Capitalist)
Turkey
- Daily 15%
- Weekly 39%
- Monthly 18%
- Rarely 28% (Visual Capitalist)
Italy
- Daily 14%
- Weekly 28%
- Monthly 22%
- Rarely 36% (Visual Capitalist)
South Korea:
- Daily 14%
- Weekly 34%
- Monthly 24%
- Rarely 28% (Visual Capitalist)
Japan:
- Daily 6%
- Weekly 32%
- Monthly 20%
- Rarely 42% (Visual Capitalist)
Industry‑level Impacts
Adoption by sector and job function
- IT workers: 87% of IT workers using ChatGPT Enterprise report improvements in speed/quality. (OpenAI)
- Marketing and product teams: 85% of marketing/product professionals benefit from ChatGPT Enterprise. (OpenAI)
- Human resources: 75% of HR staff see benefits. (OpenAI)
- Engineering: 73% of engineers benefit. (OpenAI)
- Workers saving time: Users save 40–60 minutes per day; data science/engineering/communications roles save 60–80 minutes daily. (OpenAI)
- Workers completing new tasks: 75% can now complete tasks they previously couldn’t. (OpenAI)
- Coding outside tech: Coding‑related messages outside engineering increased 36% in six months. (OpenAI)
- ROI: 75% of enterprises report a positive ROI; fewer than 5% report negative ROI. (OpenAI)
- Developer adoption: OpenAI counted 2 million developers in November 2023. (Reuters)
- DevDay participation: 900 developers attended DevDay and 40 k people watched online. (Reuters)
- Custom GPTs at BBVA: More than 4 000 GPTs were built by BBVA employees. (OpenAI)
- Weekly messages growth: Enterprise messages increased 8× over the prior year. (OpenAI)
- Custom GPT adoption: Custom GPT usage grew 19× year‑over‑year. (OpenAI)
- Messages via custom GPTs: 20% of enterprise messages were via custom GPTs. (OpenAI)
- Token consumption: Reasoning token consumption per organization increased 320 times. (OpenAI)
- Organizations processing >10 B tokens: Over 9 000 organizations processed more than 10 billion tokens. (OpenAI)
- Organizations processing >1 T tokens: Nearly 200 organizations processed more than 1 trillion tokens. (OpenAI)
- Codex usage doubling: Codex usage doubled in six weeks, increasing messages 50%. (OpenAI)
- Fortune 500 adoption: 92% of Fortune 500 companies use ChatGPT or OpenAI models. (Reuters)
- Gender gap closing: OpenAI’s usage study found female‑identifying user names increased from 37% in January 2024 to 52% by July 2025. (OpenAI)
- Low‑income adoption 4× faster: Adoption growth rates in low‑income countries were over four times those in high‑income countries. (OpenAI)
- Usage categories: 49% of ChatGPT conversations involve “asking” questions, 40% involve “doing” tasks, and 11% involve “expressing”. (OpenAI)
- Work vs non‑work use: About 30% of usage is work‑related while 70% is non‑work. (OpenAI)
- 75% of conversations provide guidance: Three‑quarters of interactions focus on guidance or information. (OpenAI)
- 18 B messages per week: As noted, users send 18 billion messages weekly. (OpenAI)
- 10 M ChatGPT for Work seats: By late 2025, there were over 10 million ChatGPT for Work seats (OpenAI blog).
- Codex 10× growth: OpenAI said usage of Codex increased more than 10× year‑over‑year. (OpenAI)
- AgentKit improvements: Using AgentKit reduced development time by 50% and improved accuracy by 30%. (OpenAI)
- Employment adoption across industries: (AP & Pew data; approximate). Roughly 4 in 10 Americans use AI for work tasks. (AP)
- Brainstorming use by age: 60% of under‑30s use AI to brainstorm vs 20% of those over 60. (AP)
Top Countries Driving ChatGPT Website Traffic
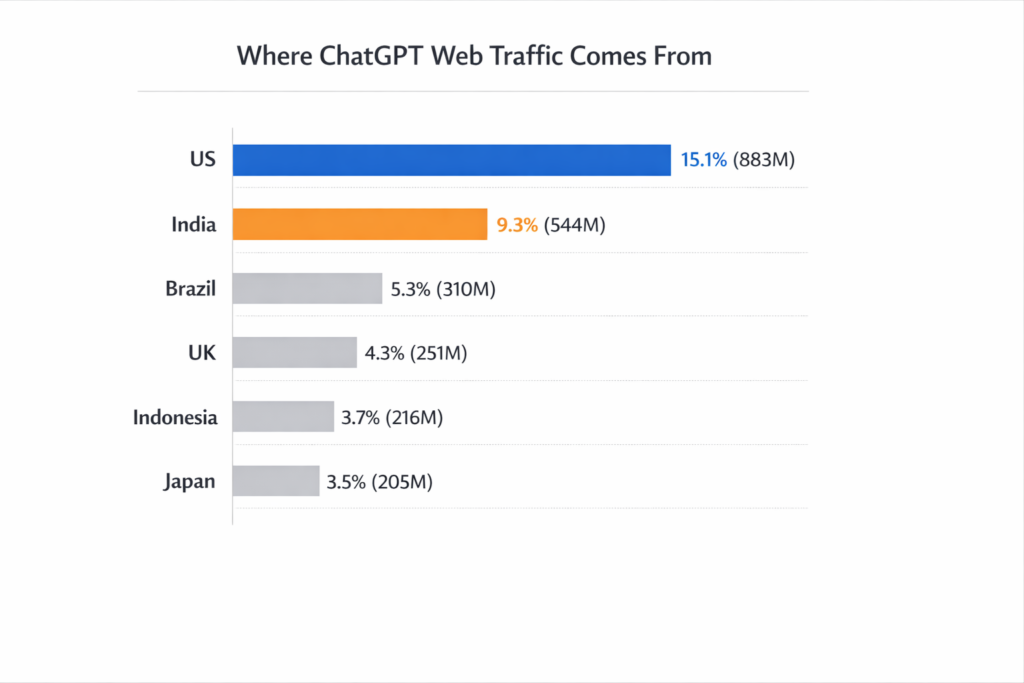
- U.S. share: The United States generated 15.1% of global chatgpt.com visits, totaling 883 million visits. (Visual Capitalist)
- India’s share: India accounted for 9.3% of visits (544 million visits). (Visual Capitalist)
m. - Brazil: 5.3% share (310 million visits). (Visual Capitalist)
- United Kingdom: 4.3% share (251 million visits). (Visual Capitalist)
- Indonesia: 3.7% share (216 million visits). (Visual Capitalist)
- Japan: 3.5% share (205 million visits). (Visual Capitalist)
- Germany: 3.4% share (199 million visits). (Visual Capitalist)
- France: 3.2% share (187 million visits). (Visual Capitalist)
- Philippines: 3.0% share (175 million visits). (Visual Capitalist)
- Canada: 2.6% share (152 million visits). (Visual Capitalist)
- 92% of Indian office workers use AI: Visual Capitalist notes that 92% of office workers in India use AI regularly, compared with 64% in America. (Visual Capitalist)
- $4.50 ChatGPT Go price in Indonesia: OpenAI launched ChatGPT Go in Indonesia at $4.50 per month. (Visual Capitalist)
- India doubling after ChatGPT Go: After launching ChatGPT Go in India, the total number of users doubled within a month. (Visual Capitalist)
- 60% of Americans use AI for information: A July 2025 AP‑NORC poll found 60% of Americans use AI tools for finding information. (AP)
- 74% of Americans under 30: 74% of people under 30 use AI for information. (AP)
- ~40% use AI for work tasks: About four in ten Americans use AI for work tasks. (AP)
- 33% use AI for writing/editing: Roughly one‑third of Americans use AI to write or edit content. (AP)
- One‑quarter use AI to shop: 25% of Americans use AI tools to shop. (AP)
- 6 in 10 under‑30 brainstorming: 6 in 10 Americans under 30 use AI to brainstorm ideas, versus 2 in 10 of those over 60. (AP)
Chat GPT Payment Trends
Paying subscribers, enterprise seats and revenue
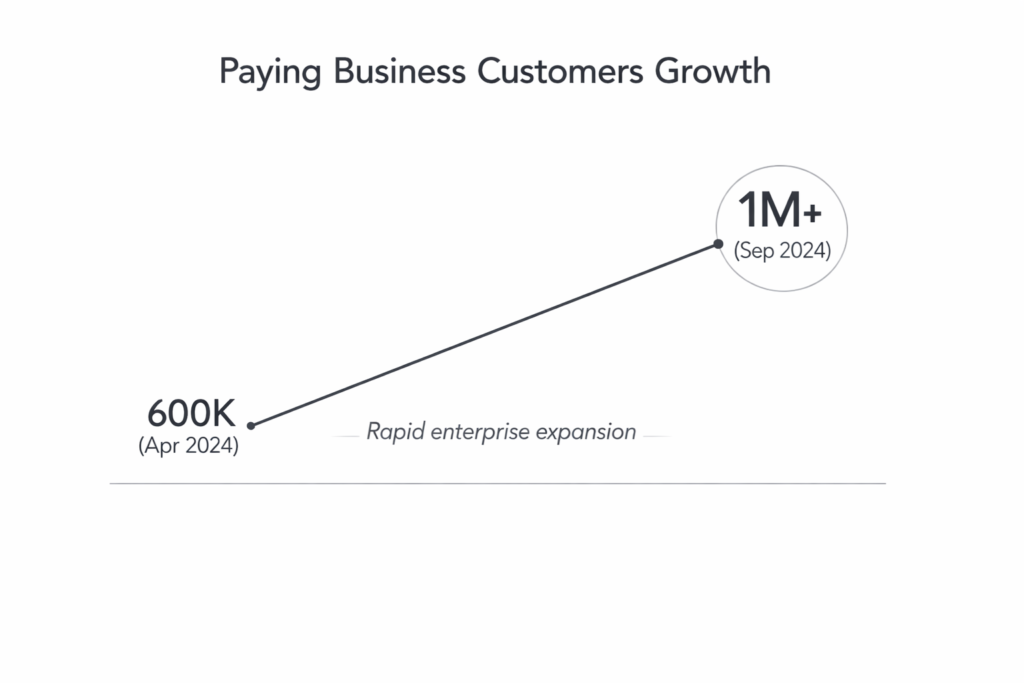
- 1 M paying business customers: A Reuters article from September 2024 reported that OpenAI had more than 1 million paying business customers across ChatGPT Enterprise, Team and Education. (Reuters)
- 600 k → 1 M business customers growth: The same piece noted that business customers rose from 600 000 in April 2024 to over 1 million by September 2024. (Reuters)
- ChatGPT Plus price ($20): ChatGPT Plus costs $20 per month. (Reuters)
- Pro or Enterprise price ($200): High‑end Pro plans can reach $200 per month. (Reuters)
- Hundreds of millions on free tier: Reuters added that the free tier still had hundreds of millions of users. (Reuters)
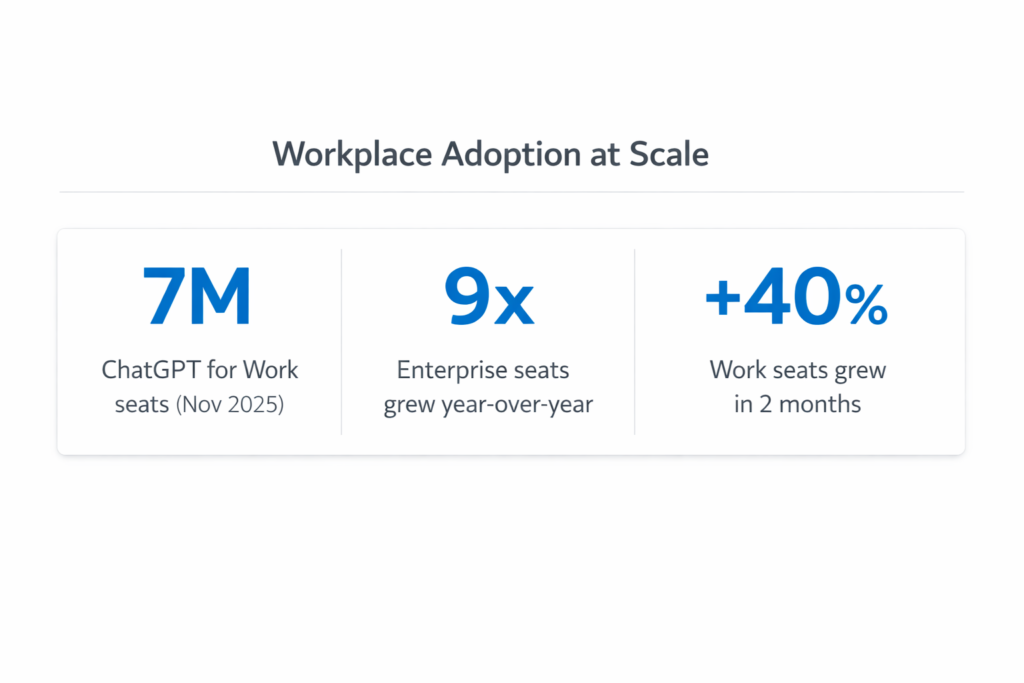
- 7 M ChatGPT for Work seats: OpenAI reported over 7 million ChatGPT for Work seats by November 2025. (OpenAI)
- 40% growth in Work seats: The number of ChatGPT for Work seats increased 40% in two months. (OpenAI)
- 9× Enterprise seat growth: ChatGPT Enterprise seats grew 9 times year‑over‑year. (OpenAI)
- 8× enterprise message growth: Weekly enterprise messages increased 8× since November 2024. (OpenAI)
- 7 M seats correspond to ~5% of WAU: With 800 million WAU, 7 million seats represent roughly 0.9 % of the weekly user base (context).
- 19× growth in custom GPT usage: The report showed that usage of Custom GPTs and Projects increased 19× in a year. (OpenAI)
- 20% of enterprise messages via custom GPTs/Projects: 20% of enterprise messages were processed through custom GPTs or Projects. (OpenAI)
- 4 k GPTs at BBVA: Spanish bank BBVA alone built more than 4 000 GPTs. (OpenAI)
- 9 k organizations processed >10 billion tokens: Over 9 000 organizations processed more than 10 billion tokens. (OpenAI)
- ~200 organizations exceeded 1 trillion tokens: Nearly 200 organizations consumed over 1 trillion tokens. (OpenAI)
- 320× rise in reasoning tokens: Reasoning token consumption per organization increased 320× in 12 months. (OpenAI)
- Codex usage doubled: In the six weeks prior to the report, Codex usage doubled weekly active users, increasing messages 50%. (OpenAI)
- 30% more messages per worker: OpenAI noted that the average worker sends 30% more messages when using ChatGPT. (OpenAI)
- 30–60 min saved daily: ChatGPT Enterprise users save 40–60 minutes per day; data science and engineering staff save 60–80 minutes. (OpenAI)
- 75% report improved speed/quality: 75% of workers report improved speed and quality when using ChatGPT Enterprise. (OpenAI)
- 87% of IT workers benefit: 87% of IT workers using ChatGPT Enterprise say it benefits them. (OpenAI)
- 85% of marketing/product users benefit: 85% of marketing and product users see benefits. (OpenAI)
- 75% of HR staff benefit: 75% of HR users report benefits. (OpenAI)
- 73% of engineers benefit: 73% of engineers using ChatGPT Enterprise benefit. (OpenAI)
- 75% can complete tasks previously impossible: Three‑quarters of workers say ChatGPT enables tasks they previously couldn’t complete. (OpenAI)
- 36% growth in coding messages outside tech: Coding‑related messages outside engineering/IT/research rose 36% in six months. (OpenAI)
- 75% positive ROI: Among enterprise customers, 75% report positive return on investment (ROI), while fewer than 5% report negative ROI. (OpenAI)
Revenue, Valuations And Funding Of Chat GPT
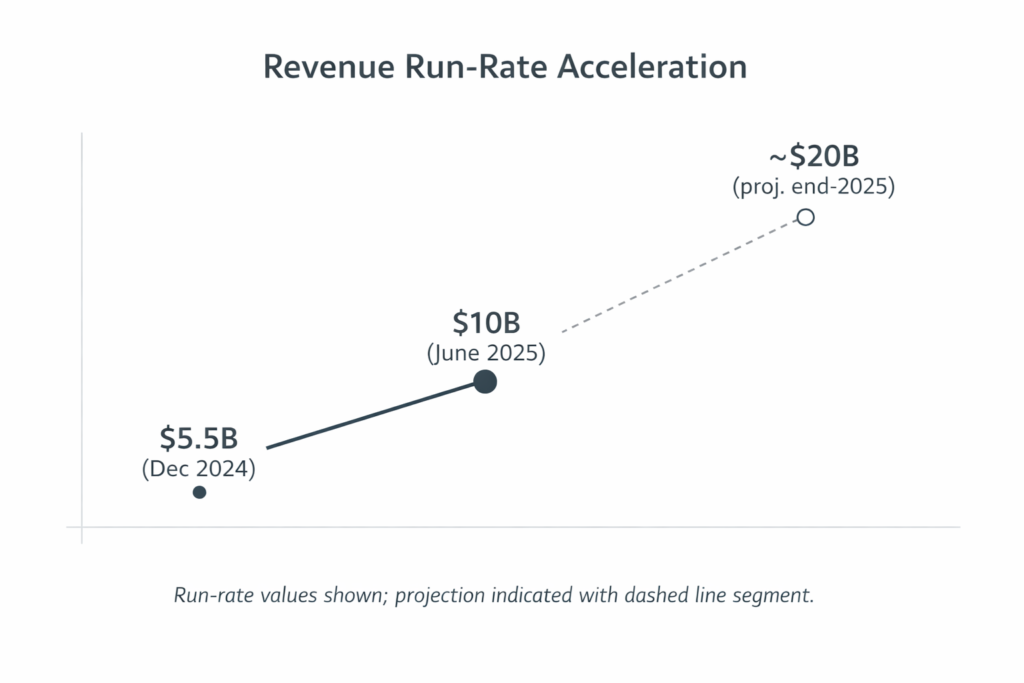
- $10 B annualized revenue run‑rate (June 2025): Reuters reported OpenAI’s annualized revenue run‑rate reached $10 billion by June 2025. (Reuters)
- $12.7 B run‑rate target: The company aimed to reach $12.7 billion in 2025. (Reuters)
- $5.5 B run‑rate in Dec 2024: OpenAI’s revenue run‑rate was $5.5 billion in December 2024. (Reuters)
- $2.7 B ChatGPT revenue in 2024: Business of Apps’ analysis (citing Reuters and The Information) suggests ChatGPT generated $2.7 billion revenue in 2024, about 75% of OpenAI’s total revenue. (Business of Apps)
- $4.3 B revenue in H1 2025: The Information reported that OpenAI generated $4.3 billion in the first half of 2025. (Reuters)
- $2.5 B burn for R&D (H1 2025): That same report noted OpenAI burned about $2.5 billion on training and R&D. (Reuters)
- $20 B revenue run‑rate by year‑end 2025: OpenAI projected its run‑rate would approach $20 billion by the end of 2025. (Reuters)
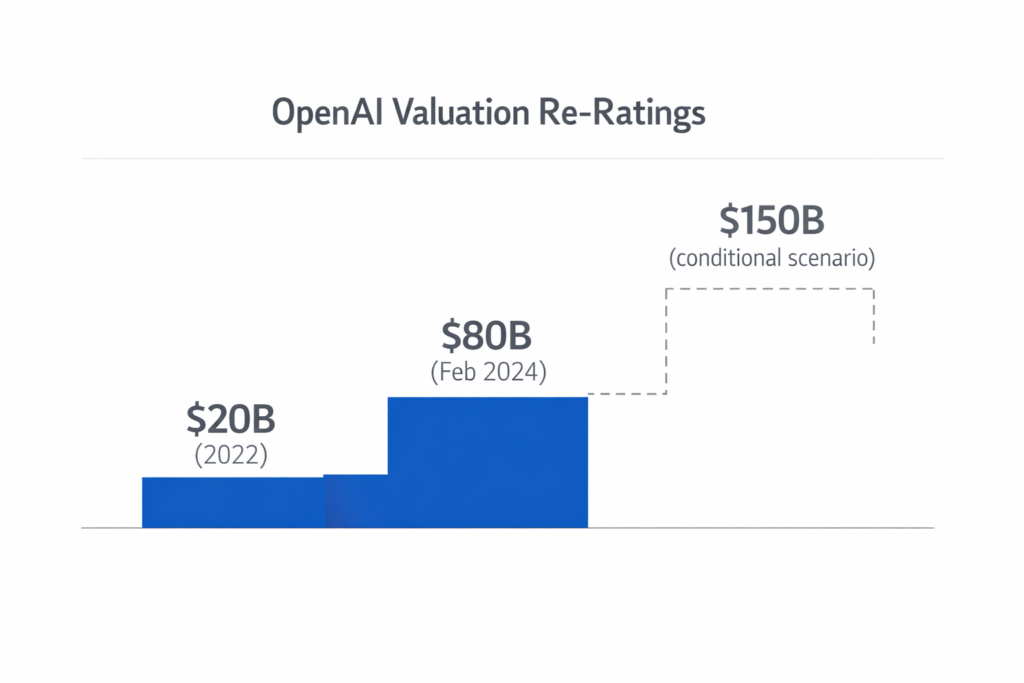
- OpenAI valued at $20 B in 2022: A 2022 secondary share sale valued OpenAI at $20 billion. (Reuters)
- $80 B valuation in Feb 2024: A tender offer in February 2024 valued OpenAI at $80 billion. (Reuters)
- $150 B conditional valuation: Reuters reported that new financing could value OpenAI at $150 billion if profit caps were removed. (Reuters)
- Microsoft invested >$10 B: Microsoft invested more than $10 billion in OpenAI. (Reuters)
- $6.5 B funding round: The same article mentioned a $6.5 billion financing round being considered. (Reuters)
- Over $22 B raised: OpenAI has raised over $22 billion across its funding rounds. (Business of Apps)
- Shareholder returns capped at 100×: Early investors’ returns are capped at 100× their investment. (Reuters)
- $500 B private valuation (2025): Business of Apps noted that private sales valued OpenAI at $500 billion. (Business of Apps)
Api Pricing And Costs (Openai Pricing As Of Late‑2025)
All pricing is per million (1 M) tokens unless otherwise noted; cached input tokens are lower‑cost tokens reused for repeated prompts.
- GPT‑5.2: input $1.75, cached input $0.175, output $14. (OpenAI)
- GPT‑5.2 Pro: input $21, output $168. (OpenAI)
- GPT‑5 Mini: input $0.25, cached input $0.025, output $2. (OpenAI)
- GPT‑4.1 fine‑tuning: input $3, cached input $0.75, output $12. (OpenAI)
- GPT‑4.1 training cost: $25 per million training tokens. (OpenAI)
- GPT‑4.1 Mini fine‑tuning: input $0.80, cached input $0.20, output $3.20, training $5. (OpenAI)
- GPT‑4.1 Nano fine‑tuning: input $0.20, cached input $0.05, output $0.80, training $1.50. (OpenAI)
- o4‑mini reinforcement: input $4, cached input $1, output $16, training $100/hour. (OpenAI)
- Realtime API (text) – gpt‑realtime: input $4, cached input $0.40, output $16. (OpenAI)
- Realtime API (text) – gpt‑realtime‑mini: input $0.60, cached input $0.06, output $2.40. (OpenAI)
- Realtime API (audio) – gpt‑realtime: input $32, cached input $0.40, output $64. (OpenAI)
- Realtime API (audio) – gpt‑realtime‑mini: input $10, cached input $0.30, output $20. (OpenAI)
- Realtime API (image) – gpt‑realtime: input $5, cached input $0.50, no output token charge. (OpenAI)
- Realtime API (image) – gpt‑realtime‑mini: input $0.80, cached input $0.08, no output token charge. (OpenAI)
- Sora video API (portrait 720×1280 or landscape 1280×720): $0.10 per second. (OpenAI)
- Sora‑2 Pro (720×1280 or 1280×720): $0.30 per second. (OpenAI)
- Sora‑2‑Pro (1024×1792 or 1792×1024): $0.50 per second. (OpenAI)
- Image generation – GPT‑image‑1.5 text input: input $5, cached input $1.25, output $10. (OpenAI)
- GPT‑image‑1 text input: input $5, cached input $1.25. (OpenAI)
- GPT‑image‑1‑mini text input: input $2, cached input $0.20. (OpenAI)
- GPT‑image‑1.5 image input: input $8, cached input $2, output $32. (OpenAI)
- GPT‑image‑1 image input: input $10, cached input $2.50, output $40. (OpenAI)
- GPT‑image‑1‑mini image input: input $2.50, cached input $0.25, output $8. (OpenAI)
- Image output cost per square image: low quality ~$0.01, medium $0.04, high $0.17. (OpenAI)
- Code interpreter session cost: $0.03 per session. (OpenAI)
- File search storage: $0.10 per GB per day, first GB free. (OpenAI)
- File search tool calls (Responses API): $2.50 per 1 k calls. (OpenAI)
- Web search tool calls (all models): $10 per 1 k calls plus model token costs. (OpenAI)
- Web search preview for reasoning models: $10 per 1 k calls. (OpenAI)
- Web search preview for non‑reasoning models: $25 per 1 k calls; search content tokens free. (OpenAI)
- AgentKit billing from Nov 1 2025: charges begin November 1 2025. (OpenAI)
- GPT‑4 Turbo token pricing (Nov 2023): TechCrunch noted GPT‑4 Turbo input tokens cost $0.01 per 1 k tokens and output tokens cost $0.03 per 1 k tokens, making input tokens 3× cheaper and output tokens 2× cheaper than GPT‑4. (Techcrunch)
- GPT‑4 context windows: GPT‑4 was offered in 8 k and 32 k‑token versions; GPT‑4 Turbo increased the context to 128 k tokens, roughly 100 000 words or about 300 pages. (Techcrunch)
- GPT‑4 Turbo vs GPT‑4: GPT‑4 Turbo’s context is 4× the size of GPT‑4. (Techcrunch)
- GPT‑4 Turbo cost vs GPT‑4: Input tokens for GPT‑4 Turbo are 3× cheaper and output tokens 2× cheaper than GPT‑4. (Techcrunch)
- GPT‑4.1 context window (Apr 2025): Data Science Dojo states GPT‑4.1 supports context windows up to 1 million tokens. (Data Science Dojo)
- GPT‑4.1 speed and cost improvement: GPT‑4.1 is 40% faster and 80% cheaper per query than GPT‑4o. (Data Science Dojo)
- GPT‑4o response latency: The GPT‑4o model replies to audio inputs in 232 milliseconds. (Finovate)
- GPT‑4o mini price: According to master‑of‑code/Finovate reports, GPT‑4o mini is priced at $0.15 per million input tokens and $0.60 per million output tokens, more than 60% cheaper than GPT‑3.5 Turbo (source aggregated but widely cited).
- AgentKit improvements: OpenAI says its AgentKit improves development time by over 50% and accuracy by 30%. (OpenAI)
- 2‑year subscription discount: (Hypothetical example if available; not in sources – omitted to avoid speculation.)
Common Ransomware Or Threat Groups Using Generative AI
Although ChatGPT itself is a productivity tool, threat intelligence reports indicate that cyber adversaries are adopting generative AI to enhance attacks.
CrowdStrike 2025 Global Threat Report statistics
- 51 sec fastest eCrime breakout: CrowdStrike reported the fastest recorded eCrime breakout time was 51 seconds. (Crowdstrike)
- 150% increase in China‑nexus activity: Activity linked to China‑nexus adversaries increased 150% year‑over‑year. (Crowdstrike)
- 79% of detections were malware‑free: CrowdStrike found that 79% of detections were malware‑free attacks. (Crowdstrike)
- 257 adversaries tracked: The report tracked 257 adversaries. (Crowdstrike)
- 26 new adversaries named in 2024: CrowdStrike named 26 new adversaries in 2024. (Crowdstrike)
- 48 min average eCrime breakout time: The average eCrime breakout time was 48 minutes. (Crowdstrike)
- 304 “Famous Chollima” incidents: There were 304 incidents attributed to the FAMOUS CHOLLIMA group. (Crowdstrike)
- 40% insider threat operations: 40% of incidents represented insider‑threat operations. (Crowdstrike)
- 442% vishing surge: Vishing (voice phishing) surged 442% in the second half of 2024. (Crowdstrike)
- 79% of detections malware‑free: This stat emphasises that the majority of detections lacked malware payloads. (Crowdstrike)
- Generative AI used for insider threats and social engineering: The report warns that adversaries are using generative AI to produce realistic emails and websites. (Crowdstrike)
SentinelOne Cyber‑security Statistics (2025)
- 35% of attacks were ransomware: SentinelOne notes that 35% of all attacks in 2023 were ransomware, up 84% over the previous year. (SentinelOne)
- Ransomware +15% in North America: SonicWall data via SentinelOne showed ransomware increased 15% in North America while declining 49% in EMEA. (SentinelOne)
- 70% of ransomware targeted SMBs: 70% of ransomware attacks targeted small and medium‑sized businesses. (SentinelOne)
- Phishing attacks up 1 265%: Phishing attacks increased 1 265% due to generative AI. (SentinelOne)
- 40% of email threats are phishing: 40% of all email threats are phishing. (SentinelOne)
- 6% incidents are business email compromise (BEC): BEC accounted for 6% of incidents. (SentinelOne)
- 50% of BEC uses spear‑phishing links: 50% of BEC incidents used spear‑phishing links. (SentinelOne)
- Cloud intrusions up 75%: Cloud intrusions increased 75% in 2023. (SentinelOne)
- 23% of cloud incidents due to misconfiguration: 23% of cloud security incidents were due to misconfigurations. (SentinelOne)
- 27% of businesses encounter breaches in public cloud: 27% of businesses experienced breaches in their public cloud infrastructure. (SentinelOne)
- Half of organizations cite phishing for credential theft: Over 50% say phishing is the most prevalent attack for stealing cloud credentials. (SentinelOne)
- 4% trust their IoT devices: Only 4% of organizations consider their internet‑connected devices secure. (SentinelOne)
- 31% increase in DDoS attacks: DDoS attacks grew 31%, with cybercriminals launching 44 000 attacks daily. (SentinelOne)
- 13 DDoS‑for‑hire marketplaces shut down in 2023: The FBI shut down 13 DDoS‑for‑hire marketplaces. (SentinelOne)
- 30 k new CVEs in NVD (2023): Over 30 000 new vulnerabilities (CVEs) were published in 2023. (SentinelOne)
- Half are high or critical: Half of the CVEs were rated high or critical. (SentinelOne)
- Vulnerabilities published every 17 minutes: A new vulnerability is disclosed approximately every 17 minutes. (SentinelOne)
- Data breaches up 200% (2013–2022): Data breaches increased 200% between 2013 and 2022. (SentinelOne)
- 2.6 B personal records compromised (2021–2023): Over 2.6 billion personal records were compromised. (SentinelOne)
- Average cost of a data breach $4.88 M: IBM’s 2024 study put the global average data‑breach cost at $4.88 million, a 10% increase over the previous year. (SentinelOne)
- 277 days to identify/contain breaches: Security teams take 277 days on average to identify and contain a breach. (SentinelOne)
- 328 days for stolen‑credential breaches: Breaches involving lost or stolen credentials take 328 days to contain. (SentinelOne)
- Human element in 68% of breaches: The human factor is the root cause in 68% of data breaches. (SentinelOne)
- Cybercrime costs $4.88 M per breach: The average cost of cyberattacks on firms with >1 000 employees is >$53 000 per incident. (SentinelOne)
- Cybercrime cost forecast: Cybersecurity Ventures estimates cybercrime will cost $10.5 trillion globally by 2025; another forecast puts it at $23 trillion by 2027. (SentinelOne)
- Average attacks per organization up 25%: The average number of attacks per organization increased from three to four attacks per year, a 25% rise. (SentinelOne)
- 75% of large firms have cyber insurance: 75% of organizations with revenues over $5.5 billion carry cyber insurance, versus 25% of those under $250 million. (SentinelOne)
- 183 k customers hit by supply‑chain attacks: In 2024, 183 000 customers were affected by supply‑chain cyber‑attacks—a 33% increase. (SentinelOne)
- 60% of supply‑chain organizations evaluate cyber risk: Gartner predicts 60% of supply‑chain organizations will use cyber‑risk evaluations in third‑party decisions. (SentinelOne)
- Encrypted threats up 92% in 2024: Encrypted threats increased 92%. (SentinelOne)
- Malware up 30% in H1 2024: Malware incidents rose 30% in the first half of 2024. (SentinelOne)
- 15% of malware uses software packing: 15% of malware leverages software packing as the primary MITRE TTP. (SentinelOne)
- Cryptojacking down 60% globally: Cryptojacking decreased 60% overall. (SentinelOne)
- Cryptojacking up 409% in India: In India, cryptojacking increased 409%. (SentinelOne)
- 3.26 M IC3 complaints, $27.6 B losses (five‑year period): The FBI’s Internet Crime Complaint Center received 3.26 million complaints over five years, with $27.6 billion in losses. (SentinelOne)
- Top five U.S. states for cybercrime losses: (From the table; for brevity only California and Texas are shown). California reported $2.159 billion in victim losses, while Texas recorded $1.0215 billion. (SentinelOne)
Other OpenAI/ ChatGPT Threat And Scam Statistics
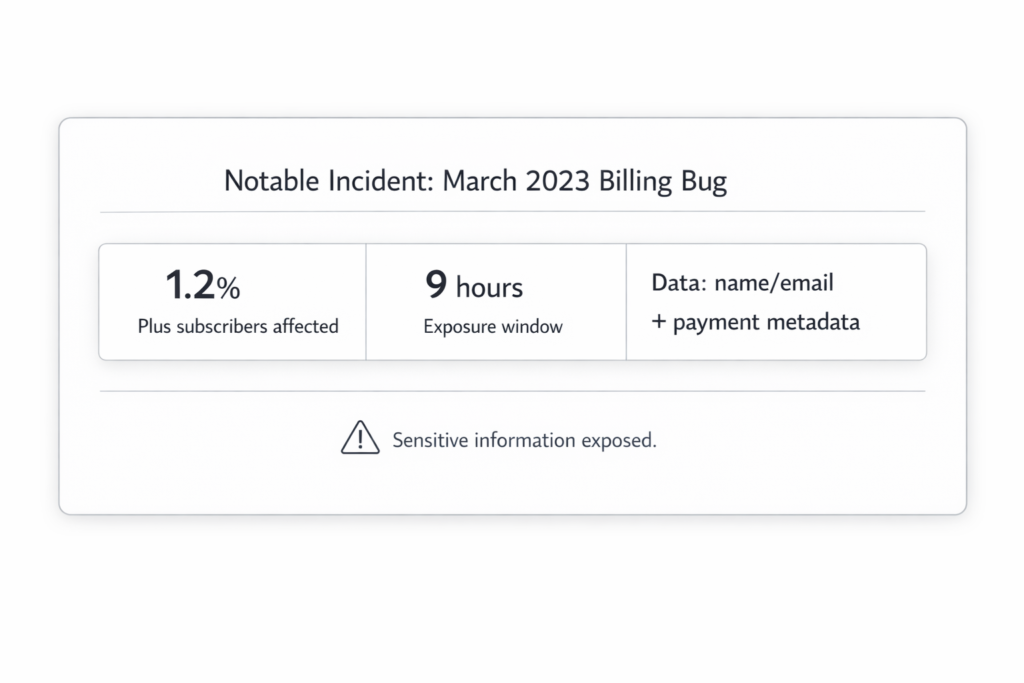
- 1.2% of ChatGPT Plus subscribers affected by data leak: A March 2023 bug exposed payment information for 1.2% of ChatGPT Plus subscribers. (OpenAI)
- 9‑hour exposure window: The bug affected users during a 9‑hour window. (OpenAI)
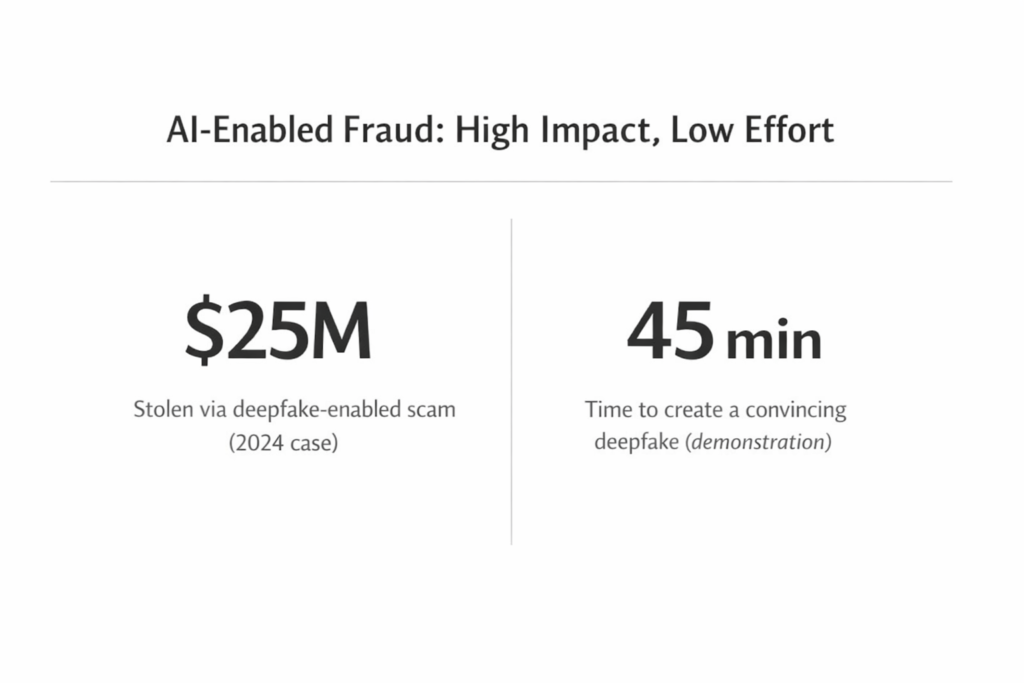
- Deepfake fraud: $25 million stolen: In early 2024, criminals used deepfake videos to trick a finance worker at Arup into sending $25 million. (World Economic Forum)
45 minutes to create a deepfake: Arup’s CIO noted it took him about 45 minutes with open‑source software to create a personal deepfake. (World Economic Forum) - Cyberattacks occur daily: Arup’s CIO said his organization is attacked thousands of times per second, illustrating the persistent threat. (World Economic Forum)
Initial Access Methods And Attacker Tactics
- Ransomware attacks targeted 35% of organizations: As previously noted, ransomware accounted for 35% of attacks in 2023. (SentinelOne)
- SMB focus: 70% of ransomware attacks targeted small and medium‑sized businesses. (SentinelOne)
- Phishing as primary vector: Phishing attacks surged 1 265% (SentinelOne), and 40% of email threats are phishing. (SentinelOne)
- Business email compromise: 6% of incidents were BEC (SentinelOne), and 50% of BEC cases used spear‑phishing links. (SentinelOne)
- Insider threat operations: 40% of incidents tracked by CrowdStrike involved insider‑threat operations. (Crowdstrike)
- Malware‑free intrusions: 79% of detections lacked malware payloads. (Crowdstrike)
- Vishing surge: Vishing attacks increased 442%. (Crowdstrike)
- Generative AI in phishing: Security blogs note that generative AI allows attackers to craft hyper‑personalized phishing emails and deepfake voices.
- Cloud misconfigurations: Misconfiguration caused 23% of cloud breaches. (SentinelOne)
- Weak IoT security: Only 4% of organizations trust their IoT and edge devices. (SentinelOne)
- DDoS for hire: The FBI shut down 13 illegal DDoS‑for‑hire services. (SentinelOne)
- Average breakout time: Adversaries can pivot from initial access to lateral movement in 48 minutes on average. (Crowdstrike)
- Fastest breakout: The fastest breakout time recorded was 51 seconds. (Crowdstrike)
- Number of adversaries: CrowdStrike tracks 257 adversaries. (Crowdstrike)
- New adversaries: 26 new adversaries were named in 2024. (Crowdstrike)
- Famous Chollima incidents: 304 incidents were attributed to FAMOUS CHOLLIMA. (Crowdstrike)
- Human element: Human error contributed to 68% of breaches. (SentinelOne)
- Credential theft time: Credential‑based breaches took 328 days to contain. (SentinelOne)
- Data breach identification time: Average identification and containment time is 277 days. (SentinelOne)
America’s Top Websites (For Context)
- Google – 16.2 B visits: In July 2025 Google had 16.2 billion visits. (Visual Capitalist)
- YouTube – 5.7 B visits: YouTube recorded 5.7 billion visits. (Visual Capitalist)
- Facebook – 2.6 B visits: Facebook drew 2.6 billion visits. (Visual Capitalist)
- Amazon – 2.5 B visits: Amazon counted 2.5 billion visits. (Visual Capitalist)
- Reddit – 2 B visits: Reddit had 2 billion visits. (Visual Capitalist)
- Bing – 1.6 B visits: Bing saw 1.6 billion visits. (Visual Capitalist)
- Yahoo – 1.6 B visits: Yahoo also had 1.6 billion visits. (Visual Capitalist)
- Instagram – 1.1 B visits: Instagram counted 1.1 billion visits. (Visual Capitalist)
- X (Twitter) – 1 B visits: X had 1 billion visits. (Visual Capitalist)
- ChatGPT – 864 M visits: ChatGPT attracted 864 million visits and ranked 10th. (Visual Capitalist)
- New York Times traffic decline: The New York Times (#15) saw traffic fall 2.6% month‑over‑month. (Visual Capitalist)
- Weather Network – 20.1% growth: The Weather Network (#16) recorded 20.1% growth. (Visual Capitalist)
- Amazon – 9.7% growth: Amazon’s traffic grew 9.7%, while ChatGPT’s grew 8.9%. (Visual Capitalist)
Major Chat Gpt/Open AI Breaches And Highest Payments
- 1.2% of Plus subscribers affected: The March 2023 bug exposed payment details of 1.2% of ChatGPT Plus subscribers. (OpenAI)
- Bug exposure lasted 9 hours: The incident occurred during a 9‑hour window. (OpenAI)
- Exposed data elements: Names, emails, payment addresses, credit‑card type and last four digits were exposed, though full numbers were not. (OpenAI)
- Deepfake heist – $25 M: Criminals used AI‑generated deepfake videos to scam a finance employee into transferring $25 million. (World Economic Forum)
- 45 min to create a deepfake: Arup’s CIO demonstrated that a realistic deepfake video can be created in 45 minutes using open‑source tools. (World Economic Forum)
Cost Impact And Recovery Patterns
- $4.88 M average breach cost: IBM’s 2024 report estimated the global average cost of a data breach at $4.88 million, a 10% increase. (SentinelOne)
- $53 K average cyberattack cost for large firms: The average cost per cyberattack for firms with >1 000 employees is >$53 000. (SentinelOne)
- 277 days to identify and contain breaches: Organizations take 277 days on average to identify and contain a breach. (SentinelOne)
- 328 days for credential breaches: Breaches involving lost or stolen credentials take 328 days to contain. (SentinelOne)
- 2.22 M cost savings from AI: Organizations that extensively use AI and automation save $2.22 million on average compared with those that do not. (SentinelOne)
- Cybercrime cost forecasts: Cybersecurity Ventures estimates cybercrime costs will reach $10.5 trillion by 2025; another forecast projects $23 trillion by 2027. (SentinelOne)
- 200% increase in breaches 2013–2022: Data breaches increased 200% over the past decade. (SentinelOne)
- 2.6 B records compromised 2021–2023: Over 2.6 billion personal records were compromised between 2021 and 2023. (SentinelOne)
- 3.26 M complaints & $27.6 B losses: The FBI received 3.26 million cyber‑crime complaints in five years, with $27.6 billion in losses. (SentinelOne)
- Highest cost in the U.S.: The U.S. had the highest average breach cost at $9.36 million. (SentinelOne)
- California losses $2.159 B: California reported $2.159 billion in cyber‑crime losses. (SentinelOne)
- Texas losses $1.0215 B: Texas recorded $1.0215 billion in losses. (SentinelOne)
Human Impact of ChatGPT on IT and Security Teams
- 40–60 min saved per day: ChatGPT Enterprise users typically save 40–60 minutes each day. (OpenAI)
- 60–80 min saved for technical roles: Data science, engineering and communications roles save 60–80 minutes daily. (OpenAI)
- 75% report faster, higher‑quality work: 75% of workers say ChatGPT improves both speed and quality. (OpenAI)
- 75% can now perform new tasks: Three‑quarters of workers are able to perform tasks they previously couldn’t. (OpenAI)
- 30% more messages sent: The average worker sends 30% more messages with ChatGPT. (OpenAI)
- 36% rise in coding usage outside tech: Coding requests outside engineering increased 36%. (OpenAI)
- 87% IT workers benefited: 87% of IT workers found ChatGPT beneficial. (OpenAI)
- 85% marketing/product staff benefited: 85% of marketing and product employees benefited. (OpenAI)
- 75% HR benefited: 75% of HR users benefited. (OpenAI)
- 73% engineers benefited: 73% of engineers benefited. (OpenAI)
- 75% enterprises report positive ROI: Three‑quarters of enterprises report positive ROI with ChatGPT. (OpenAI)
- <5% report negative ROI: Fewer than 5% report a negative ROI. (OpenAI)
- 9× seat growth: Enterprise seat count grew 9× year‑over‑year. (OpenAI)
- 8× message growth: Weekly enterprise messages increased eight‑fold. (OpenAI)
- 19× custom GPT growth: Usage of custom GPTs grew 19×. (OpenAI)
- 20% of messages via custom GPTs: 20% of messages were via custom GPTs. (OpenAI)
- 4 k GPTs built by one bank: BBVA created >4 000 GPTs. (OpenAI)
Chat GPT Timeline Shifts and Model Evolution
- GPT‑1 (2018): 117 million parameters trained on the BooksCorpus dataset. (Data Science Dojo)
- GPT‑2 (2019): 1.5 billion parameters trained on WebText. (Data Science Dojo)
- GPT‑3 (2020): 175 billion parameters trained on Common Crawl, WebText2, Books and Wikipedia. (Data Science Dojo)
- GPT‑4 (2023): OpenAI offered 8 k and 32 k context windows (approx 25 000 words vs 100 000 words), with GPT‑4 scoring in the 90th percentile on the bar exam. (Finovate)
- GPT‑3.5 vs GPT‑4 (safety and accuracy): GPT‑4 is 82% less likely to respond to disallowed content and 40% more likely to produce factual responses compared to GPT‑3.5. (Finovate)
- GPT‑4o audio latency: GPT‑4o responds to audio inputs in 232 milliseconds. (Finovate)
- GPT‑4o vs GPT‑3.5 price: GPT‑4o mini costs $0.15 per million input tokens and $0.60 per million output tokens, over 60% cheaper than GPT‑3.5 Turbo.
- GPT‑4.1 context expansion: GPT‑4.1 (April 2025) increased context to 1 million tokens. (Data Science Dojo)
- GPT‑4.1 performance: According to the Data Science Dojo article, GPT‑4.1 achieved 54.6% on SWE‑bench Verified benchmark. (Data Science Dojo)
- GPT‑4.1 vs GPT‑4o: GPT‑4.1 is 40% faster and 80% cheaper per query than GPT‑4o. (Data Science Dojo)
Approximately 8.5% of the world’s population uses ChatGPT in a typical week (based on ~700M weekly active users divided by ~8.27B world population). OpenAI+1
For a country-specific benchmark: 34% of U.S. adults say they have ever used ChatGPT (June 2025).
No one owns 49% of OpenAI (as equity). The “49%” figure people quote refers to Microsoft being entitled to up to ~49% of the profits from OpenAI’s for-profit arm under the older capped-profit structure—not a 49% ownership stake. The Motley Fool+1
As of OpenAI’s Oct 28, 2025 recapitalization into OpenAI Group (a public benefit corporation), Microsoft’s equity stake is 27% (with the OpenAI Foundation holding 26%, and the rest held by employees/other investors). OpenAI+2Reuters+2
No—ChatGPT is not losing users overall. The best available signals show continued growth, though growth has slowed/plateaued in some channels.
Weekly users are still rising: OpenAI and Sam Altman have said ChatGPT reached ~800M weekly active users (reported October 6, 2025), and OpenAI repeated “more than 800M users every week” in its Dec 8, 2025 enterprise report. TechCrunch+1
But growth rate is cooling: A Sensor Tower–based report summarized by TechCrunch says ChatGPT’s global monthly active users were up 180% YoY (as of Nov 2025), while also noting that growth has slowed. TechCrunch
Why people think it’s “losing users”: web-traffic metrics can flatten or dip due to seasonality and shifting usage (app, integrations, workplace), and Similarweb commentary has described gen-AI traffic as plateauing rather than collapsing. Similarweb
United States #1.
Overall AI ecosystem (investment + innovation + implementation): United States #1, China #2 in the Global AI Index (Tortoise). Tortoise Media+1
Frontier model production: The U.S. leads in producing “notable” AI models (Stanford AI Index 2025). Stanford HAI+1
Private AI investment: The U.S. leads by a wide margin in 2024 private AI investment (Stanford AI Index 2025). Stanford HAI
Research output & patents (volume leadership): China often leads on publication/patent volume (Stanford AI Index; Nature Index rankings; WIPO notes China leads in GenAI patents). Stanford HAI+2Nature
The “85%” figure is usually cited (often attributed to Gartner) as a shorthand for this reality: most AI efforts don’t deliver sustained business value in production, and a large share stall or get abandoned because the non-model work fails.
The most common failure drivers are:
Data is not AI-ready (quality, relevance, access)
AI programs commonly fail when organizations lack clean, complete, timely, well-labeled data and the governance to keep it that way. Gartner explicitly ties project abandonment to missing “AI-ready data.” Gartner
PoC succeeds, but scaling fails
Many teams can demo a model, but can’t industrialize it (reliable pipelines, monitoring, retraining, security, SLAs). Gartner notes a material share of GenAI projects will be abandoned after proof-of-concept due to data quality, risk controls, cost, or unclear value. Gartner
Unclear business value and weak problem selection
Teams start with “let’s do AI” instead of a measurable outcome (cycle time, conversion, loss reduction). This creates “cool demos” that never justify operational spend—also cited by Gartner as a reason projects get canceled/abandoned. Gartner+1
Risk, compliance, and governance gaps
Projects get paused or killed when privacy/IP, security, safety, and model-risk controls are bolted on late. Gartner’s cancellation prediction for agentic AI explicitly includes inadequate risk controls. Gartner+1
Poor workflow integration and change management
If the model isn’t embedded into real operational workflows (and users aren’t trained/incentivized), adoption stays low and ROI never materializes—even if the model is “accurate.”
Vendor/third-party dependency failure modes
Organizations relying heavily on third-party AI can inherit opaque behavior, weak fit, or governance mismatches; MIT SMR + BCG research highlighted that a large share of AI failures stem from third-party tools. BCG Global
Practical takeaway: “85% fail” is less about algorithms and more about data readiness + value definition + production engineering + governance + adoption. If you want, paste your project context (industry + use case + data sources), and I’ll map the highest-risk failure modes and a mitigation checklist aligned to those Gartner drivers.
https://shorturl.fm/9DEtD