
- Copyscape Plagiarism Checker Review – My Honest Take - January 23, 2026
- 250+ WordPress Statistics for 2026 - January 6, 2026
- 400+ B2B SEO Statistics for 2026 - January 5, 2026
SEO has become a core driver of B2B marketing. How enterprises research suppliers, compare solutions, and evaluate vendors increasingly depends on search visibility and content quality. From 2023–2025, generative-AI search, mobile-first behavior, voice interfaces, and tighter privacy rules reshaped SEO strategy.
This report compiles 400+ data-backed B2B SEO statistics on budgets, tactics, and outcomes to help CISOs and technical leaders make informed marketing and digital-risk decisions.
Check Out Other Stat Articles by Me
Summary of key categories
- Global trends: market size, search volume, organic vs paid traffic, click‑through behaviour and AI search impacts.
- Payment trends: SEO budget allocations, cost per lead, return on investment and expenditure by channel.
- Common SEO players and threats: market share of search engines, ranking factors, algorithm updates and technical optimisation challenges.
- Initial tactics and channels: content marketing adoption, lead‑generation channels, AI integration and buyer behaviour.
- Industry impacts: conversion rates and buyer engagement across industries such as SaaS, manufacturing, professional services and finance.
- Regional and country breakdowns: geographic differences in search behaviour, device use, local SEO and mobile statistics.
- Major budgets and standout results: high‑ROI campaigns, large marketing spends and notable shifts in traffic or revenue.
- Cost impact and recovery patterns: ROI timelines, technical SEO returns, cost savings from AI and payback periods.
- Human impact on marketing teams: resource constraints, outsourcing rates, AI adoption barriers and workload distribution.
- Timeline shifts: how buyer journeys, search habits, AI usage and budgets have changed year‑over‑year.
Global B2B SEO Stats
Market size and search volume
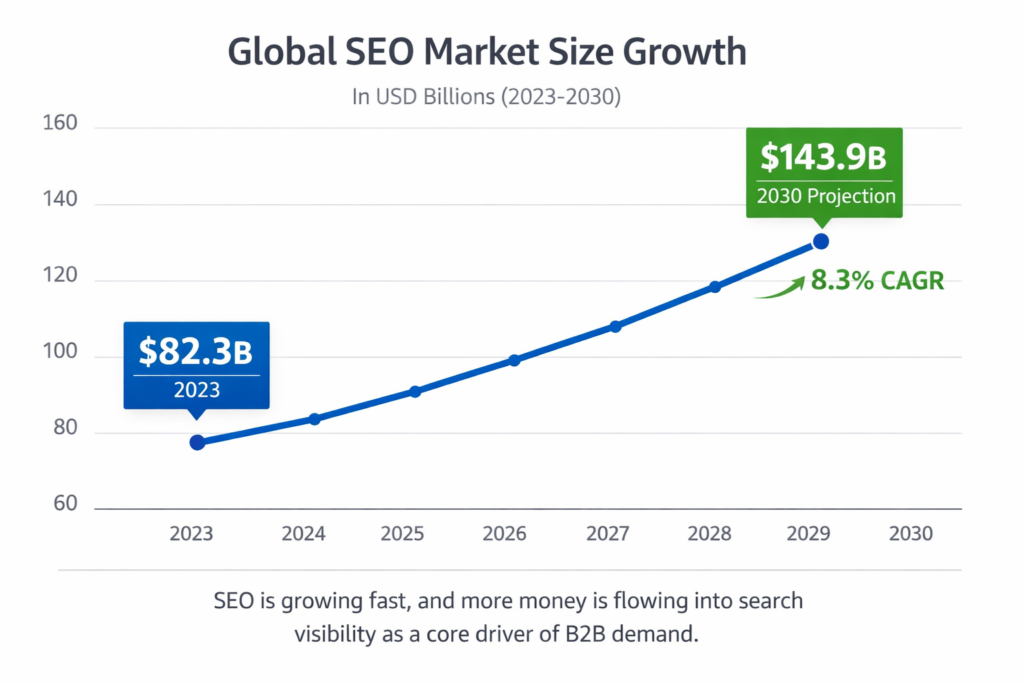
- The global SEO market was worth $82.3 billion in 2023 and is projected to reach $143.9 billion by 2030 with a compound annual growth rate of 8.3%. (Exploding Topics)
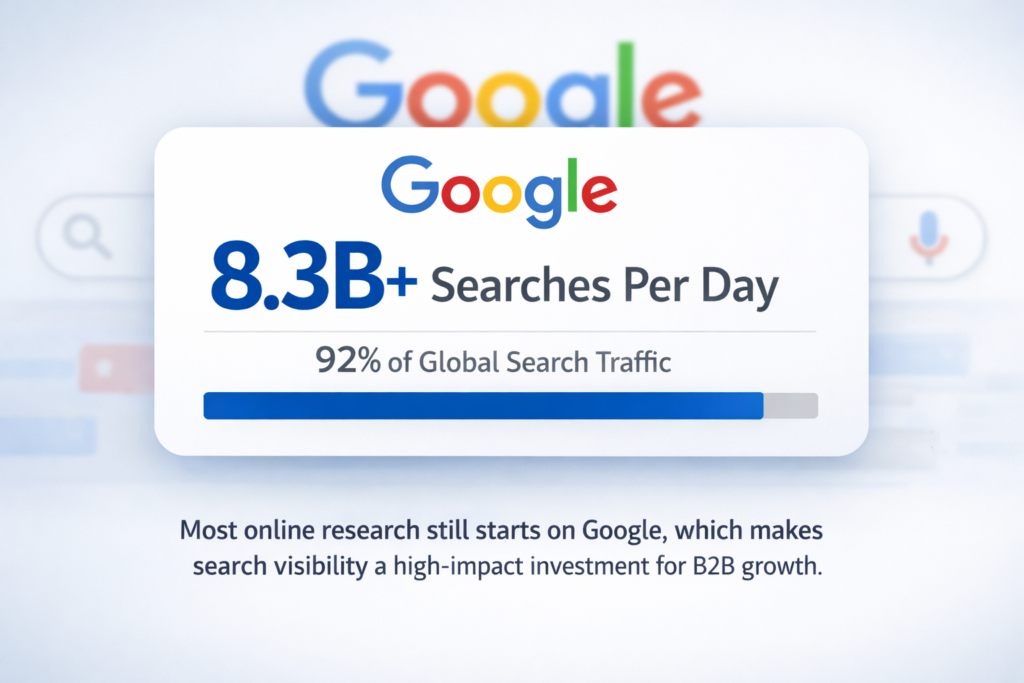
- More than 8.3 billion searches occur on Google every day. (Exploding Topics)
- Google processes around 20 billion queries per month via its Lens visual search. (Exploding Topics)
- 92% of global search traffic comes from Google. (Exploding Topics)
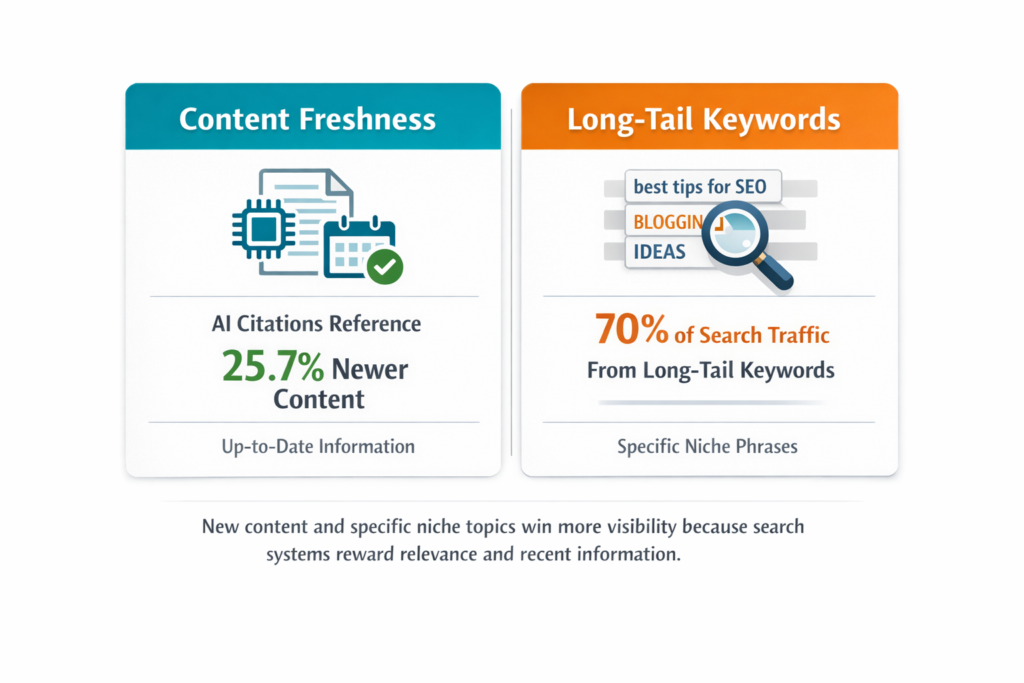
- Long‑tail keywords account for 70% of all search traffic. (Exploding Topics)
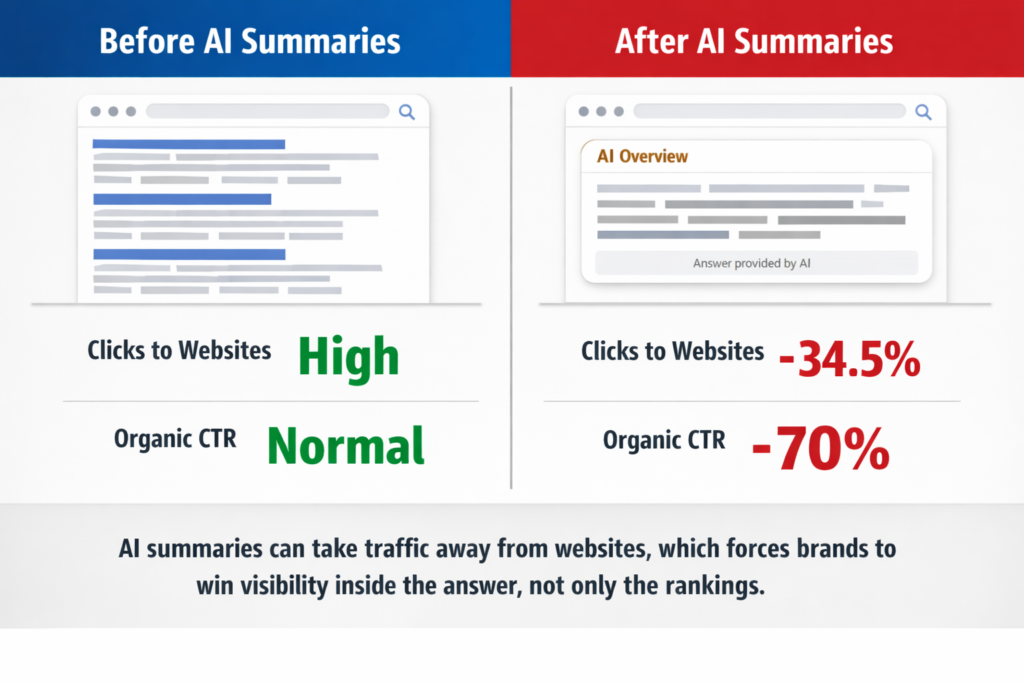
- Generative AI overviews reduce clicks on organic results by 34.5%. (Ahrefs)
- 45.7% of Google searches are branded searches. (Ahrefs)
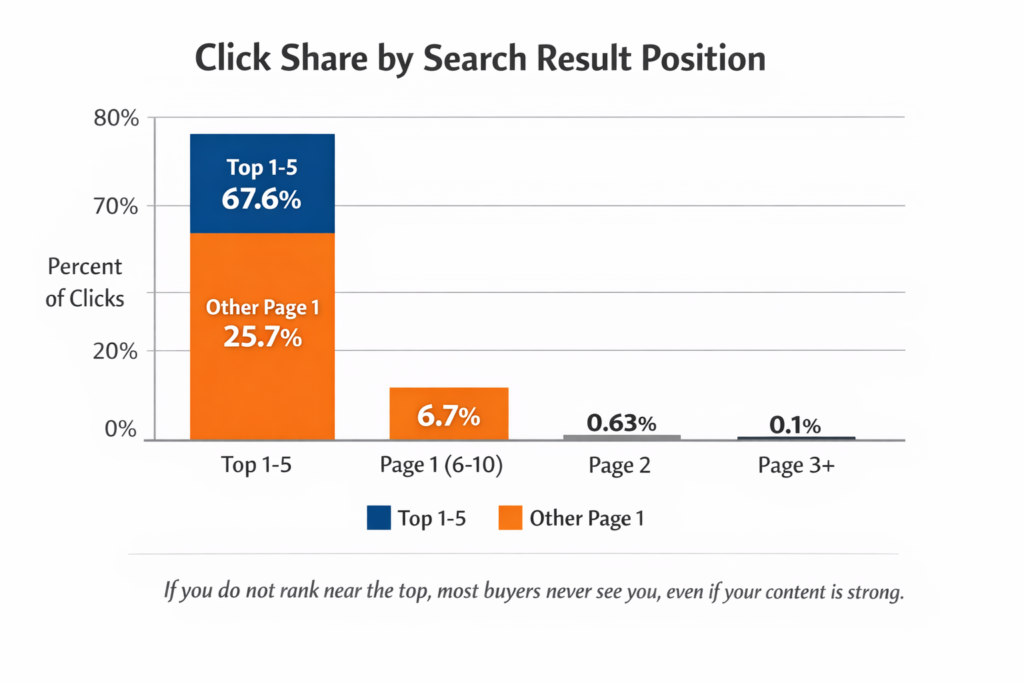
- The top five organic search results capture 67.6% of clicks. (Backlinko)
- Only 0.63% of users click on results on the second page. (Poweredbysearch)
- AI citations tend to reference content 25.7% newer than the average indexed page. (Ahrefs)
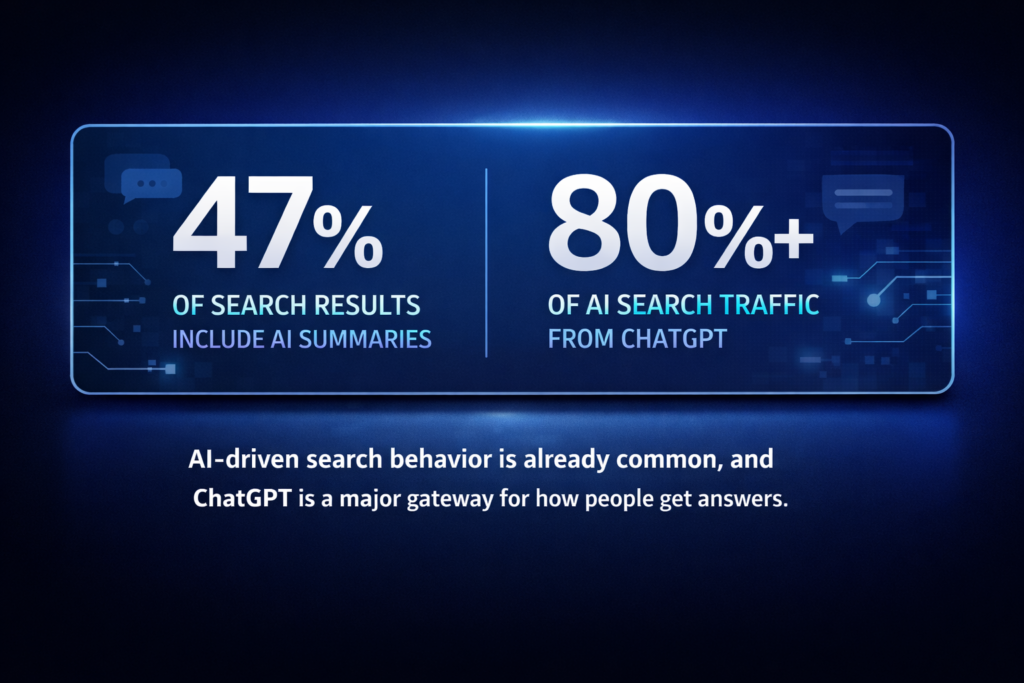
- ChatGPT grew 85% in traffic and accounts for over 80% of AI‑search traffic. (Ahrefs)
- AI summaries appear in up to 47% of search results. (Poweredbysearch)
Organic vs Paid: B2B SEO Click Data
- 68% of all online experiences begin with a search engine. (Revenuezen)
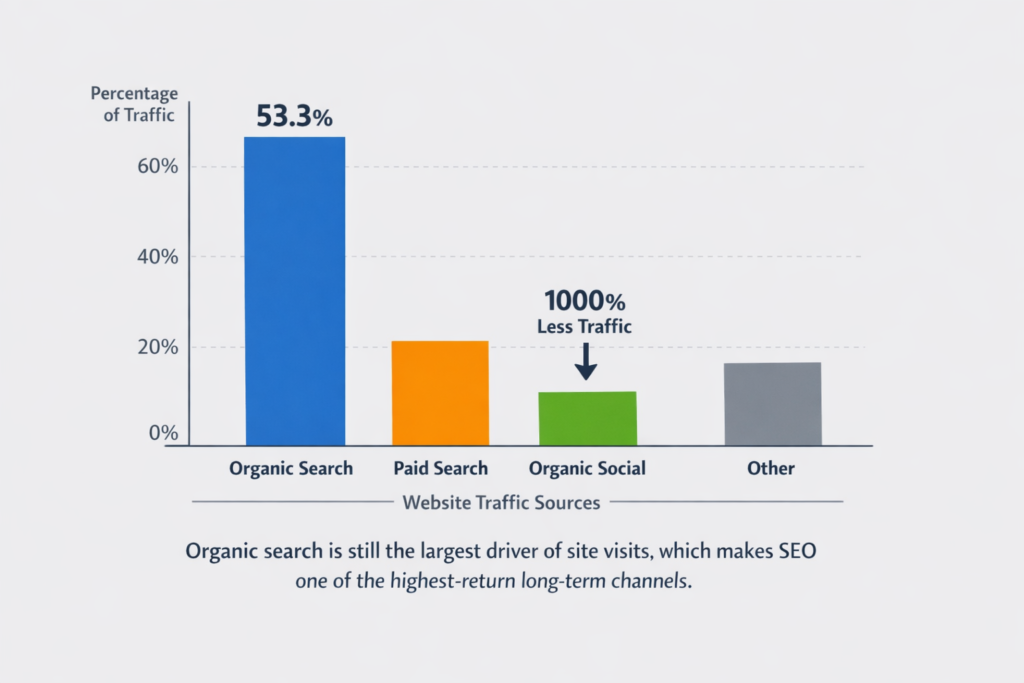
- 53.3% of website traffic is driven by organic search. (Revenuezen)
- SEO generates 1,000% more traffic than organic social media. (Revenuezen)
- The average conversion rate for organic search across industries is 5.0%. (Ahrefs)
- The average organic conversion rate ranges from 1.1% to 7.4% depending on industry. (First Page)
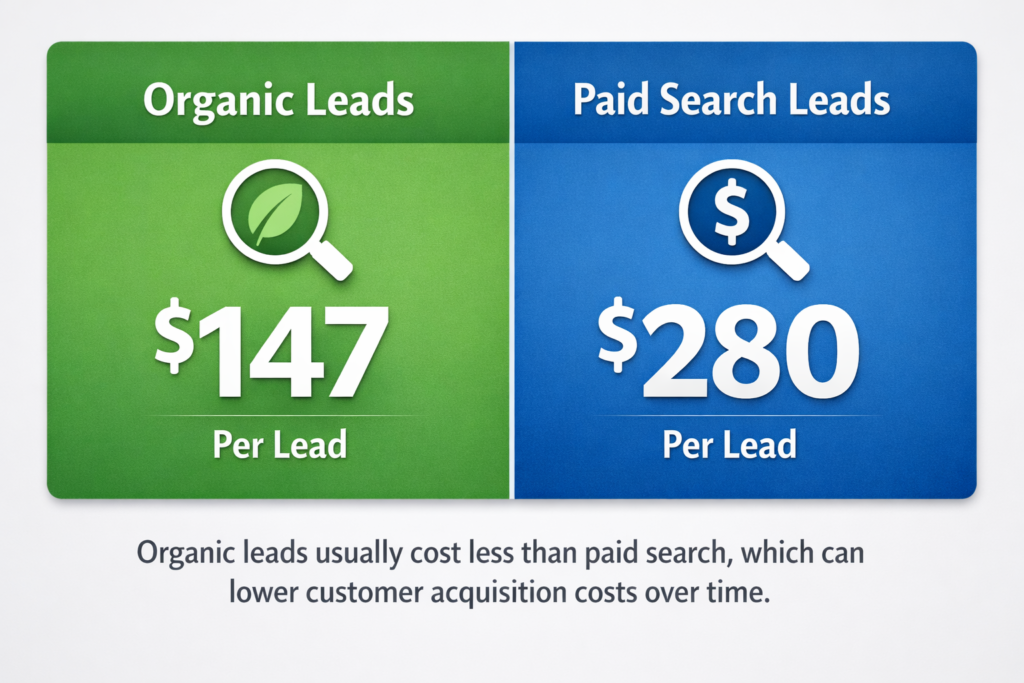
- Organic traffic costs roughly $147 per lead, whereas paid search leads cost $280. (Ahrefs)
- Companies that segment B2B SaaS audiences by industry see an average 28.7% increase in organic traffic compared to 4.1% without segmentation.
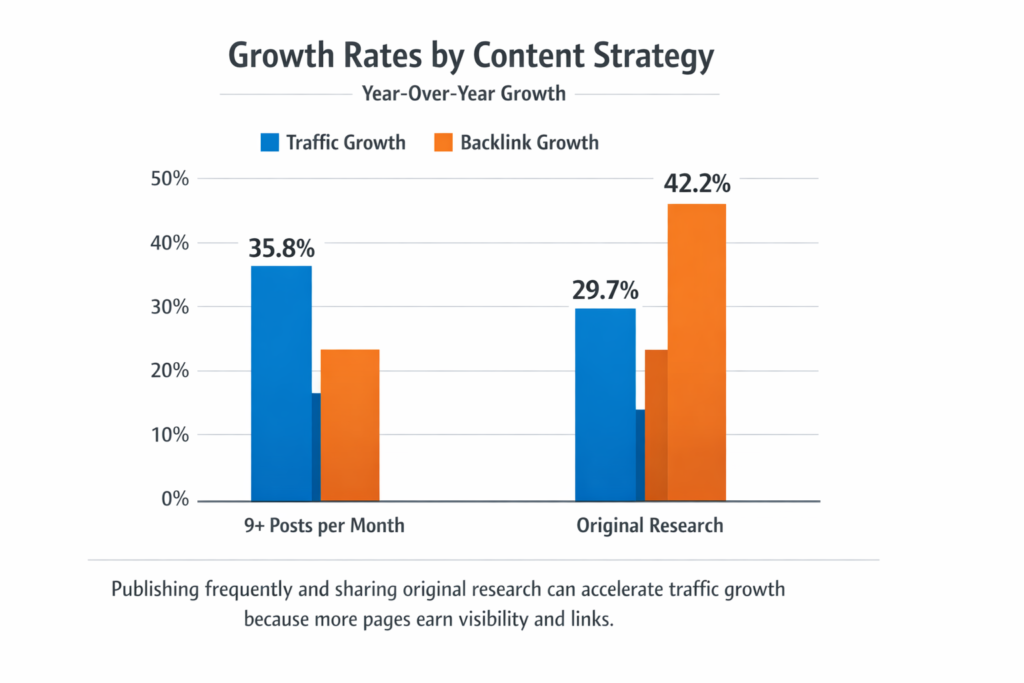
- B2B websites that offer original research see a 42.2% growth in backlinks; 96.9% gain more links overall.
- Websites publishing nine or more blog posts per month enjoy 35.8% year‑over‑year traffic growth, compared with 16.5% for sites posting 1–4 times monthly.
- Original research content increases organic traffic by 29.7%, versus 9.3% for sites without it.
- B2B websites offering free tools (e.g., ROI calculators) achieve 35.6% year‑over‑year increases in organic traffic.
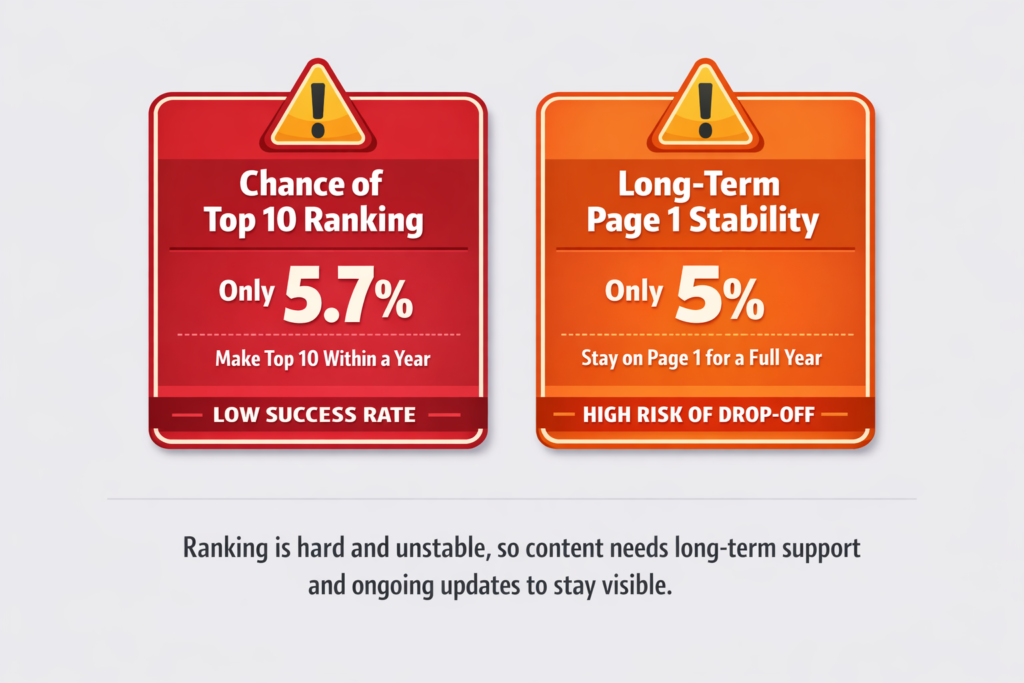
- Only 5.7% of pages rank in the top ten results within a year. (Poweredbysearch)
- Pages in the first position have 3.8 times more backlinks than those ranking lower. (Poweredbysearch)
- Featured snippets account for 50‑65% of the first result placements. (Poweredbysearch)
- Title tags between 40 and 60 characters deliver the best click‑through rates. (Poweredbysearch)
- URLs containing the target keyword increase click‑through rates by 45%. (Poweredbysearch)
- Positive‑sentiment headlines generate 4.1% higher click‑through rates. (Poweredbysearch)
- Long‑form content attracts 77.2% more backlinks than shorter pieces. (Poweredbysearch)
- After AI summaries were introduced, click‑through rates on organic results dropped 70%. (Poweredbysearch)
- Only 5% of pages maintain a first‑page ranking for a year. (Poweredbysearch)
Mobile and Emerging Interfaces: B2B SEO Stats
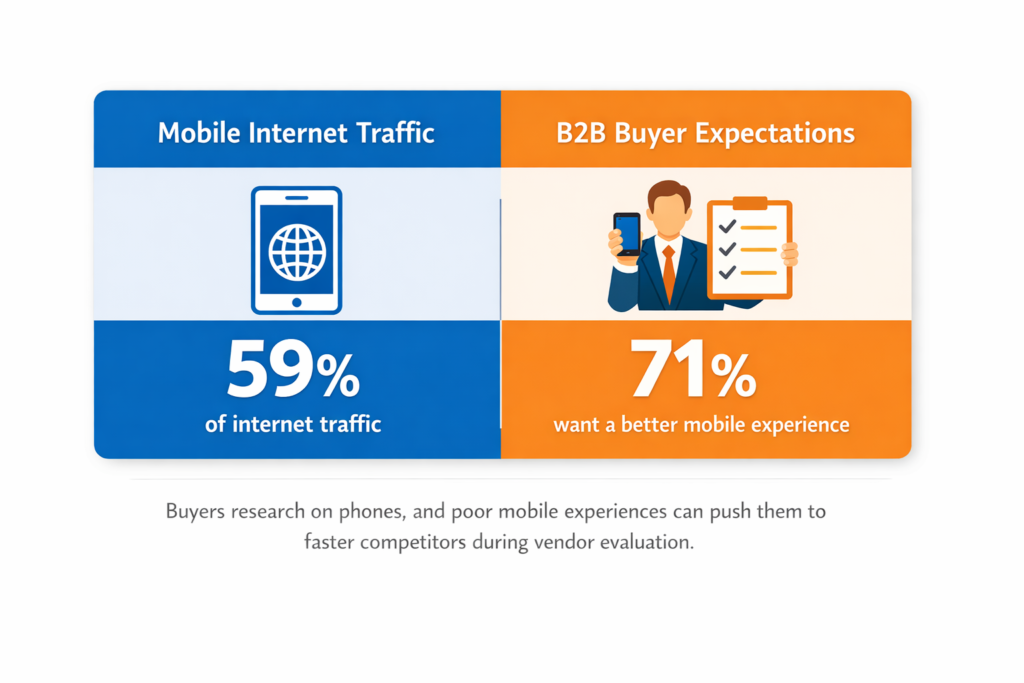
- Nearly 59% of internet traffic comes from mobile devices. (Exploding Topics)
- By the end of 2025, 72.6% of internet users will access the web exclusively via mobile.
- 63% of people use mobile to research new brands and products.
- 71% of B2B buyers want a better mobile experience.
- 29% of buyers say mobile ordering needs improvement on B2B sites.
- Mobile accounts for 59% of all internet traffic globally. (Exploding Topics)
- Voice search sees more than 1 billion queries each month. (Exploding Topics)
- Video represents 82% of global internet traffic. (Exploding Topics)
- 32% of the global population (about 2.5 billion people) used YouTube in 2024. (Exploding Topics)
- 46% of Google searches are for local information. (Exploding Topics)
- Half of “near me” mobile searches result in a physical visit within five miles. (Up Lead)
- 87% of internet users researched a local business on Google in the last year. (Up Lead)
- Less than 1% of users navigate to the second page of search results. (Up Lead)
- 15% of Google searches are completely new queries. (Up Lead)
B2B SEO Budgets, ROI, and Cost Metrics
- Budget allocations and spending intentions
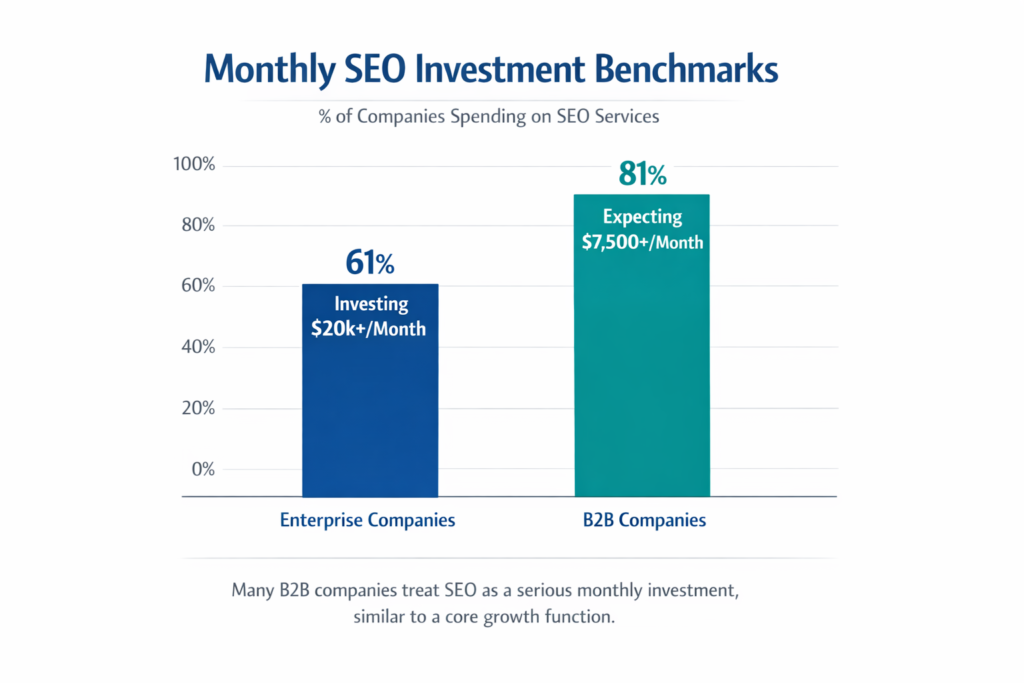
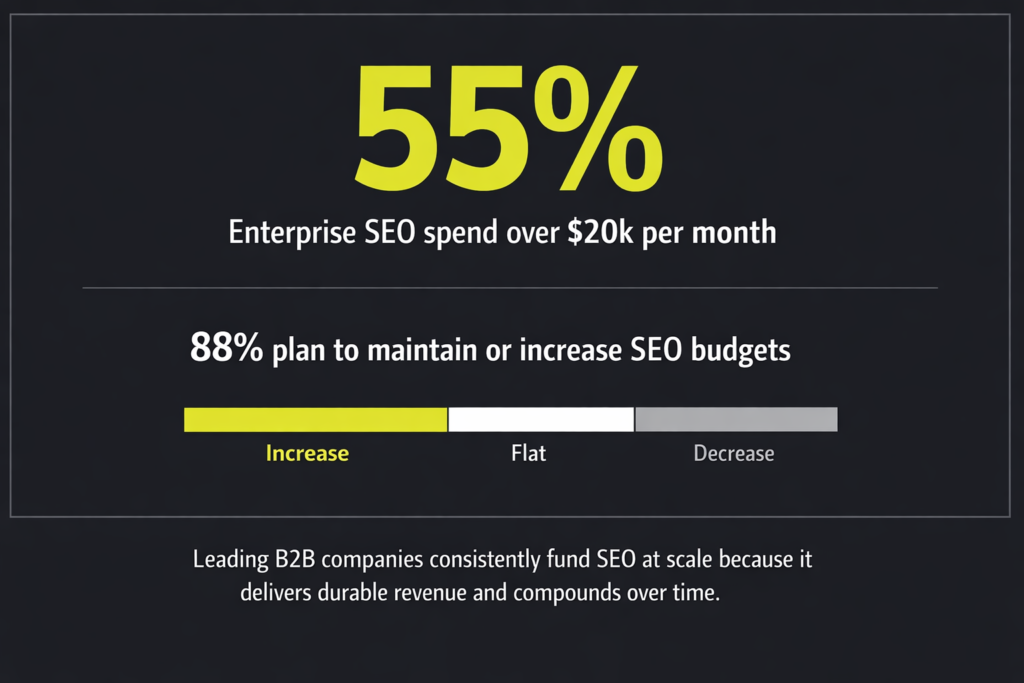
- 61% of enterprise‑level companies invest over $20,000 per month in SEO. (First Page)
- 81% of B2B companies expect to pay at least $7,500 per month for SEO services. (First Page)
- 68% of B2B marketers would redirect a mid‑level salary to outsource SEO. (First Page)
- 61% of B2B marketers rank SEO as their top inbound marketing priority. (First Page)
- 54% of businesses plan to spend most of their marketing budget on technology. (Seoprofy)
- On average, B2B marketing budgets are expected to rise 8.9% year‑over‑year with nearly 12% allocated to digital channels. (Seoprofy)
- Lead generation consumes 36% of B2B marketing budgets, while brand building uses 30% and demand generation 20%. (Seoprofy)
- 52% of organisations intend to invest more in thought‑leadership content. (Seoprofy)
- 61% of teams expect video marketing budgets to increase. (Seoprofy)
- 53% of B2B marketers spend less than one‑third of their video budget on production. (Seoprofy)
- 34% of overall marketing budgets are allocated to content marketing. (Seoprofy)
- 46% of companies expect content marketing spend growth in 2025. (Seoprofy)
- 32% of businesses report budget decreases for content efforts. (Seoprofy)
- 54% of businesses struggle with limited resources when executing SEO and marketing. (Seoprofy)
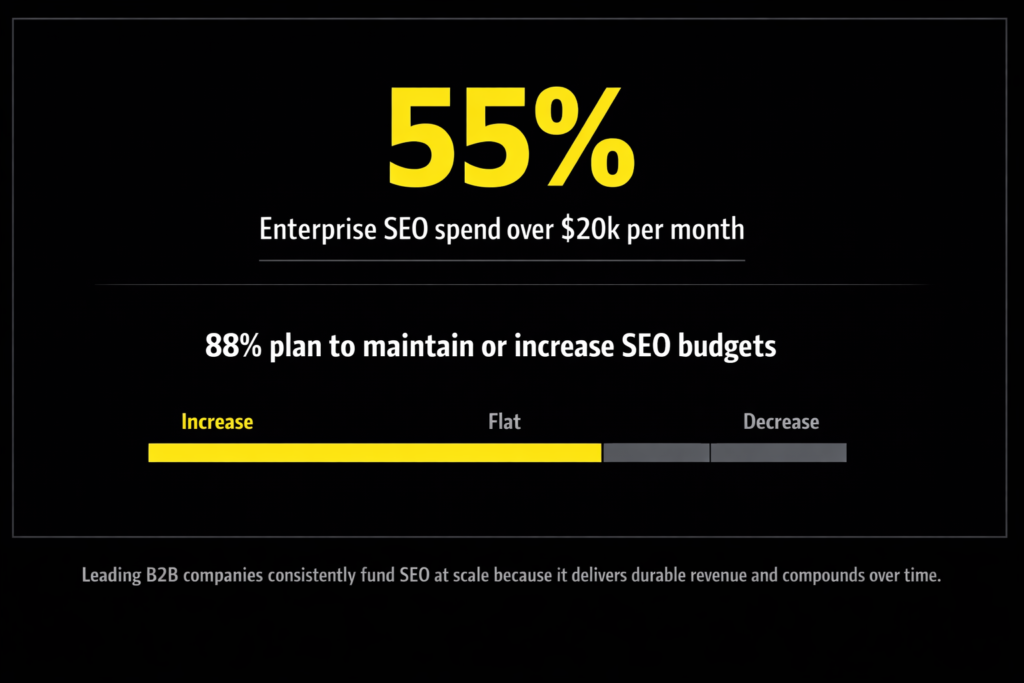
- 88% of marketers plan to maintain or increase their SEO budgets. (Up Lead)
- 65.3% of businesses allocate at least a moderate budget to SEO. (Up Lead)
- The typical monthly SEO budget per client is $1,000–$5,000, with over 50% of freelancers charging under $1,000. (Up Lead)
- 55% of enterprise‑level companies invest >$20k/month, but 81% expect to pay at least $7,500. (First Page)
- 81% of SEO professionals spend significant time on keyword research. (Up Lead)
- Over 50% of small companies assign multiple content duties to a single person, whereas only 30% of large firms do so. (Up Lead)
- 58% of B2B buyers anticipate using generative‑AI chatbots to conduct research and comparisons in the next year. (Up Lead)
B2B SEO ROI and Cost per Lead
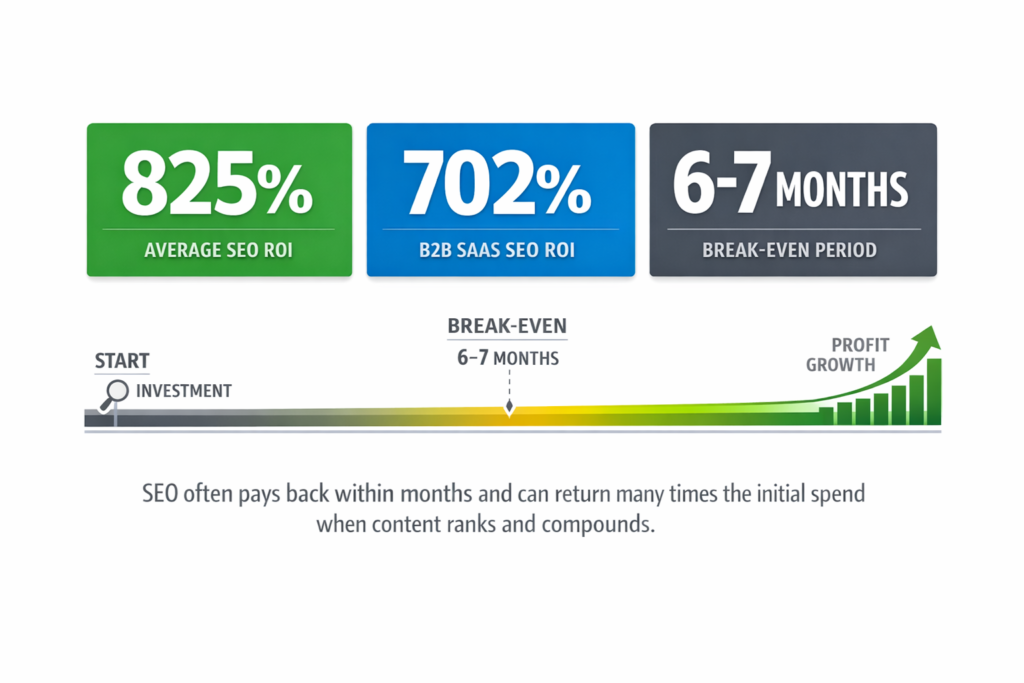
- In B2B SaaS, SEO delivers an average return on investment of 702% with a break‑even period of 7 months.
- Technical SEO has an ROI of 117%, with a break‑even timeline of 6 months. (Up Lead)
- Across all industries, SEO provides an average ROI of 825%. (Revenuezen)
- SEO drives 1000% more traffic than organic social media, dramatically reducing customer acquisition costs. (Revenuezen)
- High‑quality guest posts cost between $692 and $957 each. (Ahrefs)
- AI‑generated content is 4.7 times cheaper to produce than traditional content. (Ahrefs)
- Marketers using AI publish 42% more content. (Ahrefs)
- Companies using AI tools spend about $188 per month on those tools. (Ahrefs)
- 51% of marketers intend to increase their AI tool budgets. (Ahrefs)
- SEO offers conversion rates of 3.75% on average for B2B websites, compared with 1.77% for display ads. (First Page)
- Email marketing conversion rates average 3.9%, with industrial markets seeing 7.4% and B2B services 5.9%. (Ruler)
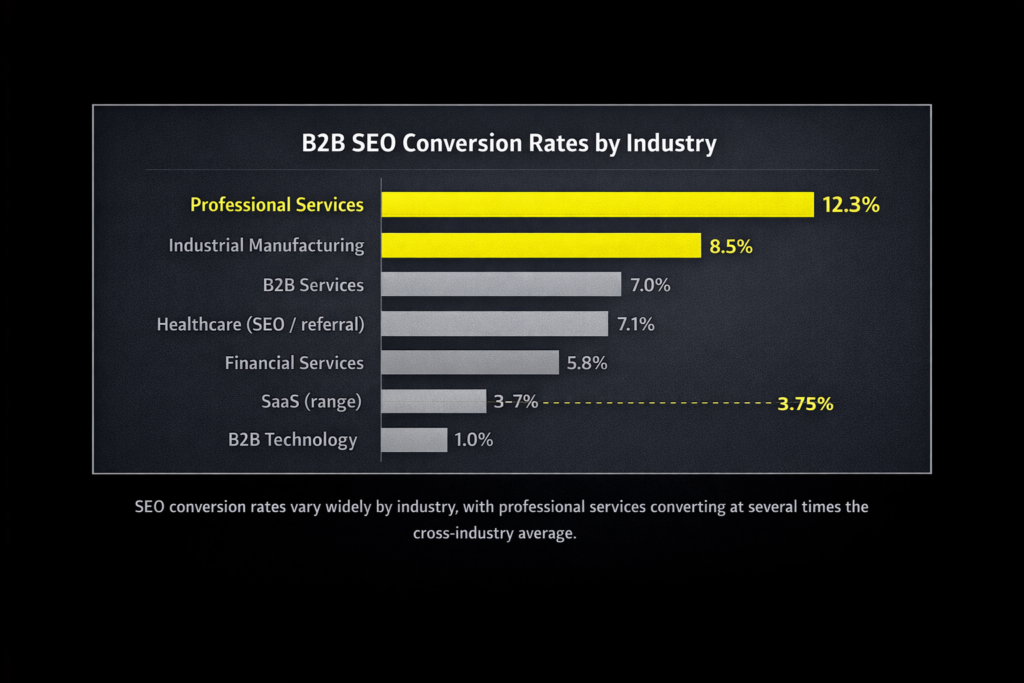
- Organic search converts at 5.0% overall, but professional services achieve 12.3%, industrial 8.5%, B2B services 7.0%, B2B tech 1.0%, eCommerce 3.5% and travel 3.5%. (Ruler)
- Paid search conversion rates average 3.6%, with professional services at 7.0%, finance 6.0%, and real estate 1.5%. (Ruler)
- Referral conversions average 4.1%, but travel reaches 9.5%. (Ruler)
- Social media conversions average 1.9%, with professional services 4.0%, healthcare 3.1%, and automotive 2.9%. (Ruler)
- Phone calls convert 10–15 times more effectively than web leads. (Ruler)
- Only 60% of marketers can demonstrate marketing ROI despite 84% believing marketing contributes to revenue. (Ruler)
- TV ad spending is expected to increase 33.1% to $2.85 billion. (Ruler)
- 41% of marketers use last‑touch attribution; 53.5% rate last‑touch models as somewhat effective. (Ruler)
- 75% of companies employ multi‑touch attribution models. (Ruler)
- 76% of marketers have or will implement marketing attribution. (Ruler)
- 57.9% use attribution software. (Ruler)
- 70% of businesses struggle to act on attribution insights, highlighting complexity. (Ruler)
- 28% cannot view channel performance due to data silos. (Ruler)
B2B SEO Platforms and Technical Risks
Market share and competition
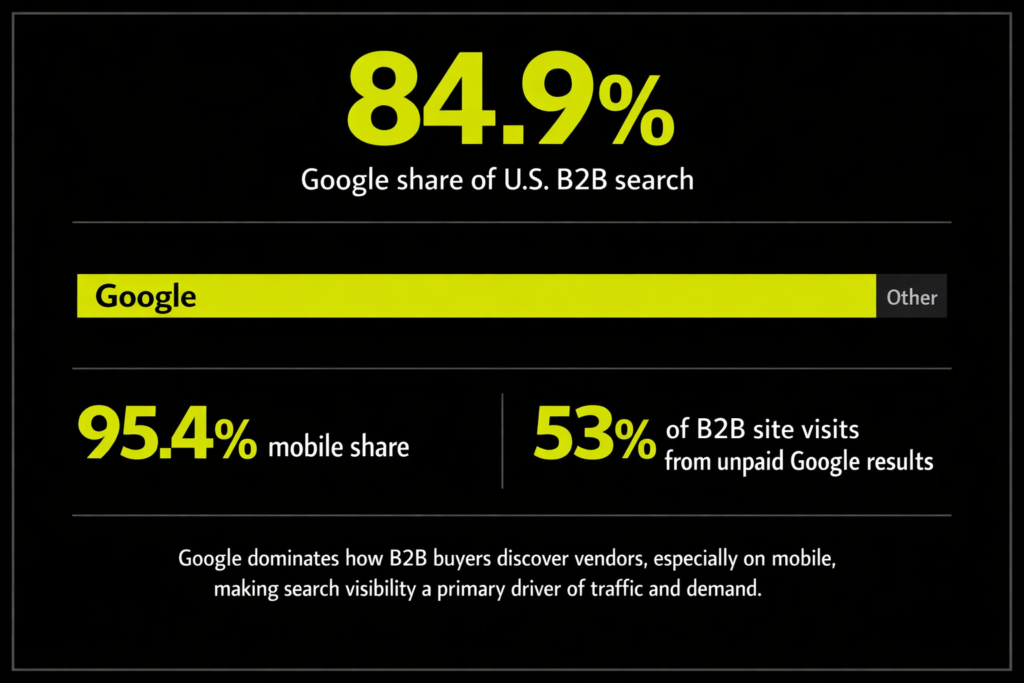
- Google dominates with 84.9% of search engine market share for the B2B audience.
- Bing holds 3.7% of the U.S. search market. (Seoprofy)
- ChatGPT has 3.2% market share in the U.S. search landscape and grew 14% year‑over‑year. (Seoprofy)
- In the U.S., Google’s mobile search share is 95.4%, while Bing captures 17.2% of desktop searches. (Up Lead)
- 66% of B2B buyers use search engines to discover products. (Backlinko)
- Marketplaces are used by 50% of buyers for discovery, social networks by 26% and TV ads by 12%. (Backlinko)
- 49% of surveyed marketers implement SEO, more than any other tactic. (Backlinko)
- SEO represents 11% of B2B marketing budgets, compared with 9% for paid search and 13% for content marketing. (Backlinko)
- 23% of B2B marketers say organic search drives the most revenue, ahead of email (17%) and paid search (16%). (Backlinko)
- 19% believe SEO is the most effective top‑of‑funnel channel. (Backlinko)
- 67.6% of organic clicks go to the top five results. (Backlinko)
- B2B buyers spend 27% of their purchase journey on online research. (Backlinko)
- Only 3% of B2B content receives multiple external links. (Backlinko)
- 55.6% of SEO professionals say technical SEO is undervalued. (Ahrefs)
- 40% of B2B companies lack internal technical SEO expertise. (Ahrefs)
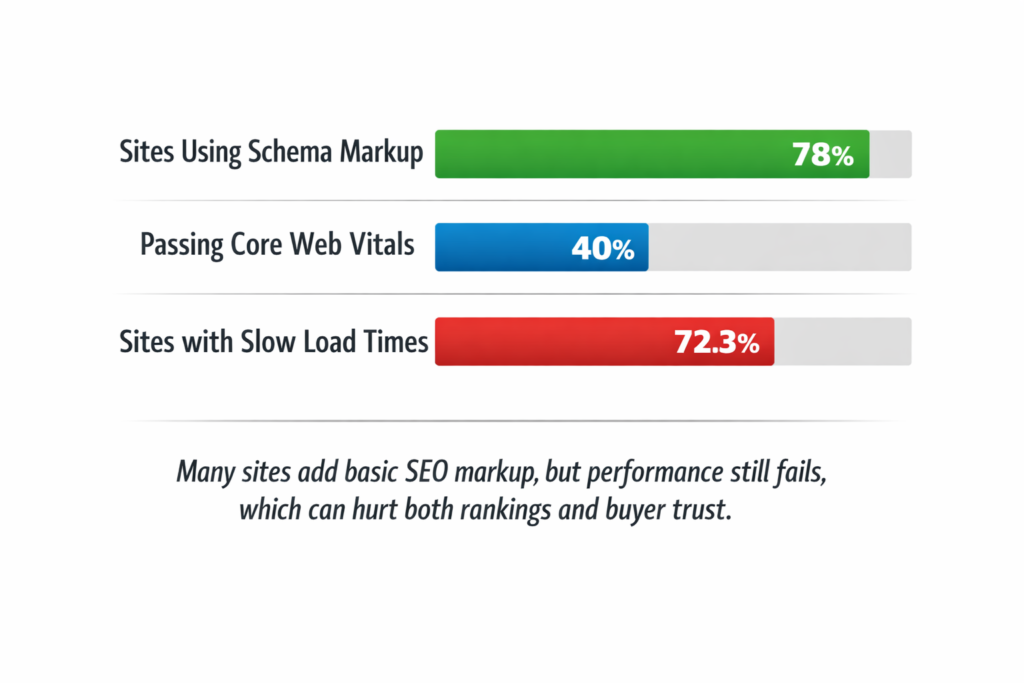
- 78% of websites use schema markup. (Ahrefs)
- Approximately 40% of websites meet Google’s Core Web Vitals standards. (Ahrefs)
- 72.3% of sites have slow loading times. (Poweredbysearch)
- 88% of users avoid returning to a site after a poor experience. (Poweredbysearch)
- 46% of Google searches involve local intent. (Exploding Topics)
- 25.6% of desktop searches result in zero clicks. (Up Lead)
- 76% of internet users worry about being misinformed by AI. (Up Lead)
- 54% of users believe they can detect AI‑generated content. (Up Lead)
- 67% say they will use ChatGPT instead of Google for some queries. (Up Lead)
- 14% of respondents are unlikely to trust AI search results. (Up Lead)
- 25% of ChatGPT’s most‑cited sources have no organic visibility. (Ahrefs)
- The top 50 brands account for 28.9% of AI overview citations. (Ahrefs)
- 76% of AI citations originate from pages ranked in the top ten results. (Ahrefs)
- More than 80% of AI‑search traffic flows through ChatGPT. (Ahrefs)
B2B SEO Technical Optimization & Ranking Factors
- 61% of SEO specialists say technical optimisation is their most effective strategy. (First Page)
- 59% of digital marketers cite link building as the hardest part of SEO. (Revenuezen)
- 70% of brands outsource link‑building efforts. (Revenuezen)
- High‑quality content and backlinks are identified as the top ranking factors by 67.5% of marketers. (Revenuezen)
- Over 90% of B2B content pieces have no backlinks. (Revenuezen)
- 41% of digital marketers view link building as the hardest SEO task. (Revenuezen)
- 78% of websites implement schema markup. (Ahrefs)
- Only 40% of websites pass Core Web Vitals tests. (Ahrefs)
- 80% of B2B buyers use mobile devices during the buying process. (Revenuezen)
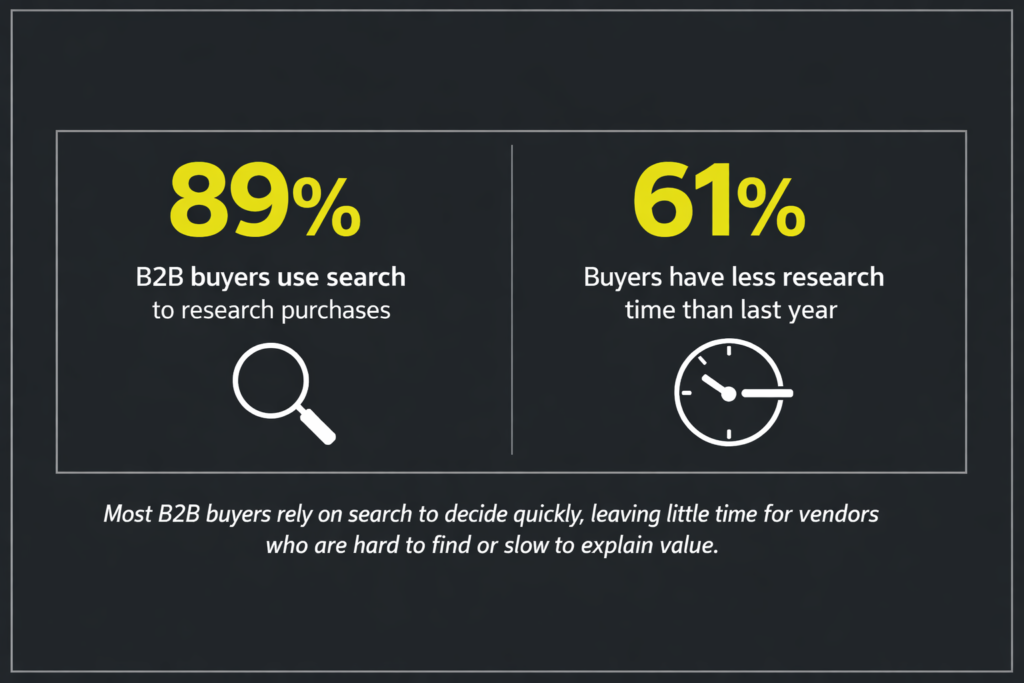
- 61% of B2B buyers report they have less time for research than the previous year. (First Page)
- The average B2B buying group has 10–11 stakeholders. (Ahrefs)
- Typical B2B buying cycles span 11.5 months. (Ahrefs)
- Only 5% of customers are “in market” at any given time. (Ahrefs)
- 81% of buyers have a preferred vendor after the first outreach. (Ahrefs)
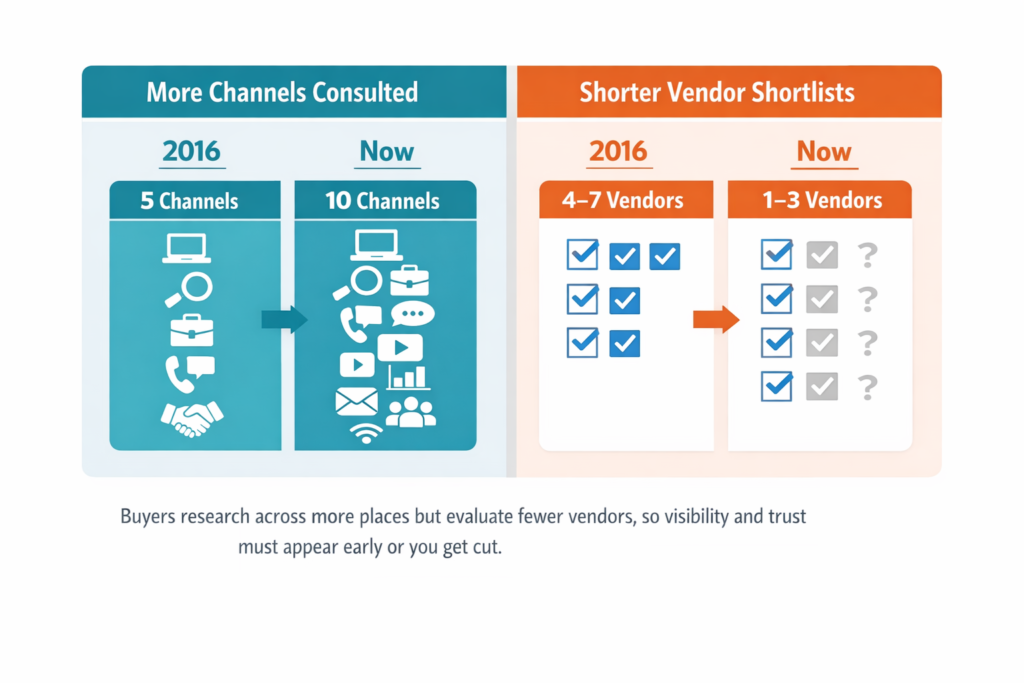
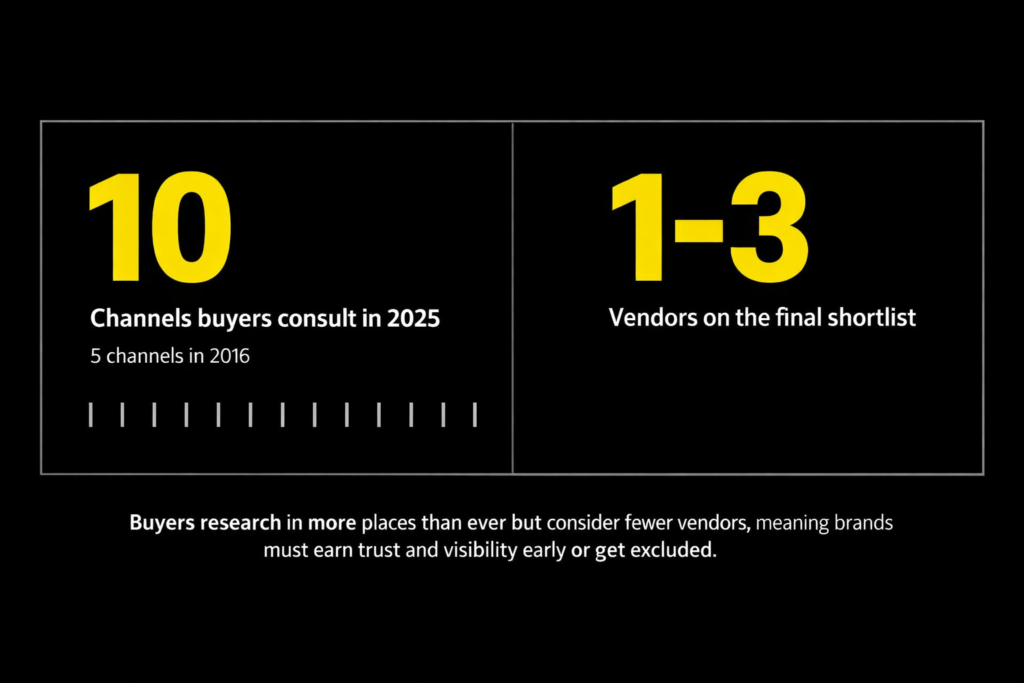
- B2B buyer shortlists have shrunk from 4–7 vendors to 1–3. (Ahrefs)
- 61% of buyers prefer a rep‑free buying experience. (Ahrefs)
- 73% of buyers avoid irrelevant outreach. (Ahrefs)
- B2B buyers consult 10 channels on average when researching a purchase (Ahrefs), (up from five in 2016).
- The typical customer journey requires 3–7 pieces of content before contacting a salesperson. (Revenuezen)
- Only 5% of decision‑makers are ready to speak with sales at any moment. (Ahrefs)
- B2B buyers spend 27% of their purchase journey on online research. (Backlinko)
- 34% of buyers say research is the longest stage of the buying journey. (Ahrefs)
- 31% consult review sites when evaluating vendors. (Ahrefs)
B2B SEO for Video, Voice, and Media
- 84% of marketers say videos keep visitors on the page longer, increasing dwell time.
- 50% of marketers include video in their overall strategy.
- 96% of video marketers report increased brand awareness from video.
- Short‑form video and images are the most popular content formats for business audiences.
- 55% of B2B buyers consider video the most helpful content type.
- 58% of marketers agree video delivers the best results for B2B companies.
- 93% of marketers say video marketing provides good ROI.
- 57% of B2B businesses believe SEO generates more leads than any other channel. (Seoprofy)
- Content marketing costs 62% less and produces 3× more leads than traditional marketing.
- Search strategies produce 34% of qualified leads.
- In‑person events are the top lead source for 45% of respondents.
- Email marketing is used by 71% of B2B companies. (Seoprofy)
- 73% of business buyers prefer vendor email for communication. (Seoprofy)
- Email newsletters deliver an ROI of $36 for every $1 spent. (Seoprofy)
- 63% of marketers distribute content via email. (Seoprofy)
- 29% of organisations rank email as their top marketing channel. (Seoprofy)
- 25% of businesses use email as their top channel. (Seoprofy)
- 96% of marketers say videos and case studies increase brand awareness. (Seoprofy)
- 21% of marketers report short‑form video delivers the highest ROI. (Seoprofy)
- Video is among the top three marketing and sales priorities for B2B companies.
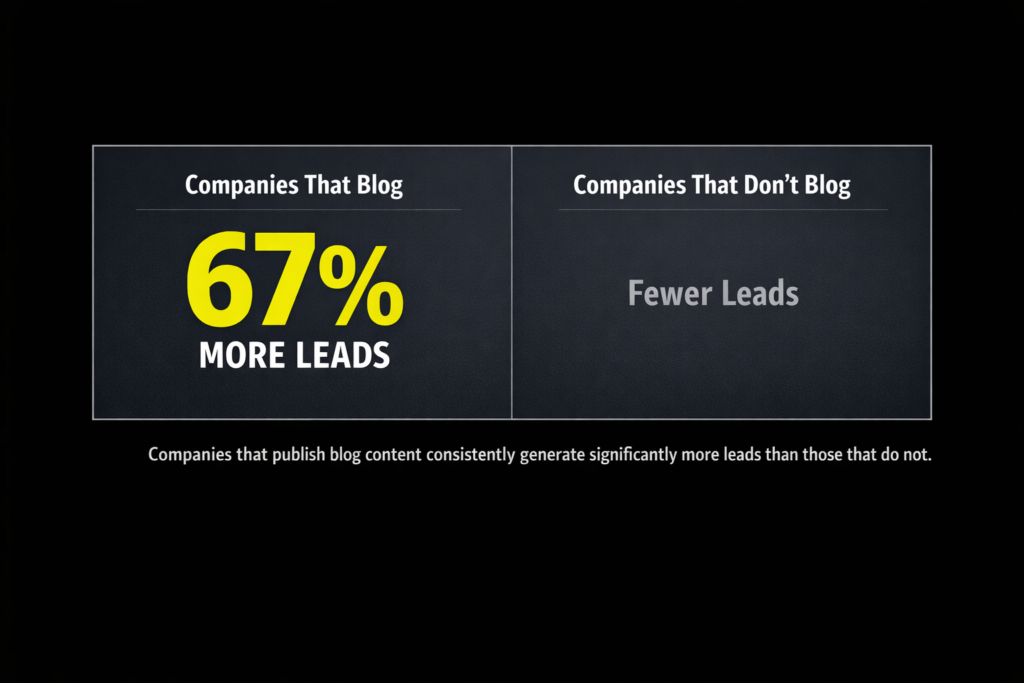
- B2B companies using blogs generate 67% more leads per month. (Seoprofy)
- 91% of marketers say SEO improved website performance. (Seoprofy)
- 22% of B2B marketers say organic search is the most effective revenue channel. (Seoprofy)
- 43% track website traffic as the primary metric, and 42% track revenue. (Seoprofy)
- 70% of marketers prefer SEO over PPC. (Seoprofy)
- Internal linking increases traffic by 37.1%. (Seoprofy)
- 92% of B2B buyers research sustainability, and 40% use the supplier’s website to verify claims. (Seoprofy)
B2B SEO Tactics and Channel Mix
Content marketing adoption
- 91% of marketers include content marketing in their strategy. (Seoprofy)
- 56% of marketers struggle to connect content to ROI. (Seoprofy)
- Only 29% of companies with a documented content strategy say it is very effective. (Seoprofy)
- 65% of B2B buyers prefer short‑form content, such as blog posts and infographics.
- Websites offering original research see 96.9% more backlinks.
- 33% of marketers regularly post blogs and articles.
- 24% of B2B companies lack a dedicated content marketing team.
- 87% of marketers say content marketing increased brand awareness.
- 34% of budgets go to content marketing. (Seoprofy)
- 36% of B2B marketers use blogs and websites as a marketing channel.
- B2B audiences consume an average of 4.5 pieces of content before contacting a salesperson.
- Websites and blogs are the second most popular digital channel, used by 36% of B2B marketers.
- 84% of marketers distribute content through a corporate blog or website.
- 29% of buyers say mobile ordering is difficult on B2B sites.
- 71% of B2B buyers desire a better mobile experience.
- 31% of B2B buyers consult review sites during research. (Ahrefs)
- B2B customers interact with 10 marketing channels on average. (Ahrefs)
- Only 5% of B2B buyers are ready to speak to sales when research begins. (Ahrefs)
- 61% of buyers prefer to buy without speaking to a sales representative. (Ahrefs)
- 73% avoid irrelevant outreach. (Ahrefs)
- Buyer shortlists decreased from 4–7 vendors to 1–3 vendors in 2025. (Ahrefs)
B2B SEO Lead Gen and Sales Cycle Data
- 74% of B2B marketers cite generating demand and leads as their top goal. (Seoprofy)
- 74% say sales cycles are getting longer. (Seoprofy)
- 52% believe data‑driven personalisation offers the biggest opportunities. (Seoprofy)
- 96% of marketers report personalised experiences increased sales. (Seoprofy)
- 20% of sales teams attribute lead generation to social media ads. (Seoprofy)
- Companies that blog generate 67% more leads per month. (Seoprofy)
- Email remains the top lead‑generation channel, used by 66% of marketers. (Seoprofy)
- Paid social is second at 58%, followed by paid search at 50%, and SEO at 47%. (Seoprofy)
- Search engine strategies contribute 34% of qualified leads.
- Organic search is viewed as an effective lead‑generation channel by 19% of respondents.
- In‑person events are considered the top source for sales and marketing leads by 45% of organisations.
- 71% of marketers use email newsletters to nurture leads. (Seoprofy)
- 63% distribute content via email. (Seoprofy)
- Marketing leaders rank better targeting (35%), higher ROI (34%) and more effective media planning (32%) as the top benefits of data‑driven marketing. (Seoprofy)
- 33% cite limited access to advanced analytics as a barrier to data‑driven marketing. (Seoprofy)
- 51.8% of senior leaders say using data effectively is the second biggest marketing challenge. (Seoprofy)
AI in B2B SEO: Adoption Stats
- 81% of B2B marketers use AI tools.
- 40% of marketers use AI to develop buyer personas.
- More than 50% will prioritise AI for automation tasks.
- 20% plan to use AI agents to automate marketing from strategy to execution.
- The top uses of AI include content creation (35%), data analysis (30%) and workflow automation (20%).
- 68% of marketers believe AI‑powered search engines will increase website traffic.
- 74% of marketers segment customers with AI. (Seoprofy)
- 62% of marketers use AI to brainstorm ideas. (Seoprofy)
- 53% use AI to summarise information. (Seoprofy)
- 44% use AI for drafting content. (Seoprofy)
- 91% say AI has improved website performance. (Seoprofy)
- 50% of businesses integrate AI into operations. (Seoprofy)
- 44% have concerns about AI data handling. (Seoprofy)
- 85% rely on AI for content creation. (Seoprofy)
- 76% need to learn specialised skills for AI adoption. (Seoprofy)
- 89% of marketers already use AI in some capacity. (Seoprofy)
- 73% use or plan to use AI chatbots. (Seoprofy)
- 75% believe AI gives their organisation a competitive advantage. (Seoprofy)
- 80% of marketers rate the importance of AI‑generated content at least 6/10. (Seoprofy)
- 30% use AI for data analysis and 20% for workflow automation. (Seoprofy)
- 91% of buyers prefer purchasing online, driving adoption of AI‑assisted self‑service.
- The average company spends $188 per month on AI tools. (Ahrefs)
- Marketers using AI publish 42% more content than those who do not. (Ahrefs)
- 87% of marketers use AI to write blog posts, 76% to brainstorm and 67% to update existing content. (Ahrefs)
B2B SEO Impact by Industry
Conversion rates by sector
- From First Page Sage’s 2025 conversion‑rate study. (First Page)
- Professional services achieve an average B2B SEO conversion rate of 12.3%. (First Page)
- Industrial manufacturing sees 8.5% conversion. (First Page)
- B2B services convert at 7.0%. (First Page)
- Financial services average 5.8% conversions. (Ruler)
- Healthcare achieves 7.1% referral conversions and 3.1% social media conversions. (Ruler)
- B2B technology has a lower conversion rate of 1.0%. (Ruler)
- eCommerce averages 3.5% conversions from organic search and 1.8% from paid search. (Ruler)
- Travel sees 3.5% conversion from organic search and 9.5% from referral traffic. (Ruler)
- Real estate experiences 1.5% conversion from paid search and 1.3% from referral traffic. (Ruler)
- Automotive has 0.8% email conversion and 2.9% social media conversion. (Ruler)
- Legal services can see conversion rates near 2.3% (noted in industry‑specific benchmarks). (First Page)
- Dental services average 1.1% conversion. (First Page)
- SaaS conversions typically range 3–7% depending on niche. (First Page)
- The average conversion rate across 25 industries is 3.75%. (First Page)
B2B Buyer Behavior and Search Stats
- Millennials account for 60% of B2B buyers, while Gen Z represent 32%. (Revenuezen)
- 95% of B2B buyers select vendors who provide sufficient content. (Revenuezen)
- 80% of B2B buyers use mobile at work. (Revenuezen)
- Over 90% of B2B content has no backlinks. (Revenuezen)
- 67.5% of marketers believe backlinks significantly impact ranking. (Revenuezen)
- 70% of brands outsource link building. (Revenuezen)
- 72% of SEOs are not yet using AI. (Revenuezen)
- 65% of businesses using AI achieve better SEO results. (Revenuezen)
- 89% of B2B buyers use search to research purchases. (Revenuezen)
- 81% of buyers prefer brands that present trustworthy thought leadership. (Ahrefs)
- 51% of decision makers say thought leadership helps convince them to award business. (Ahrefs)
- 79% say high‑quality thought leadership influences requests for proposals (RFPs). (Ahrefs)
- 61% of B2B buyers feel they have less research time than last year. (First Page)
- 95% of decision makers are receptive to vendors with strong thought leadership. (Ahrefs)
SaaS B2B SEO Benchmarks
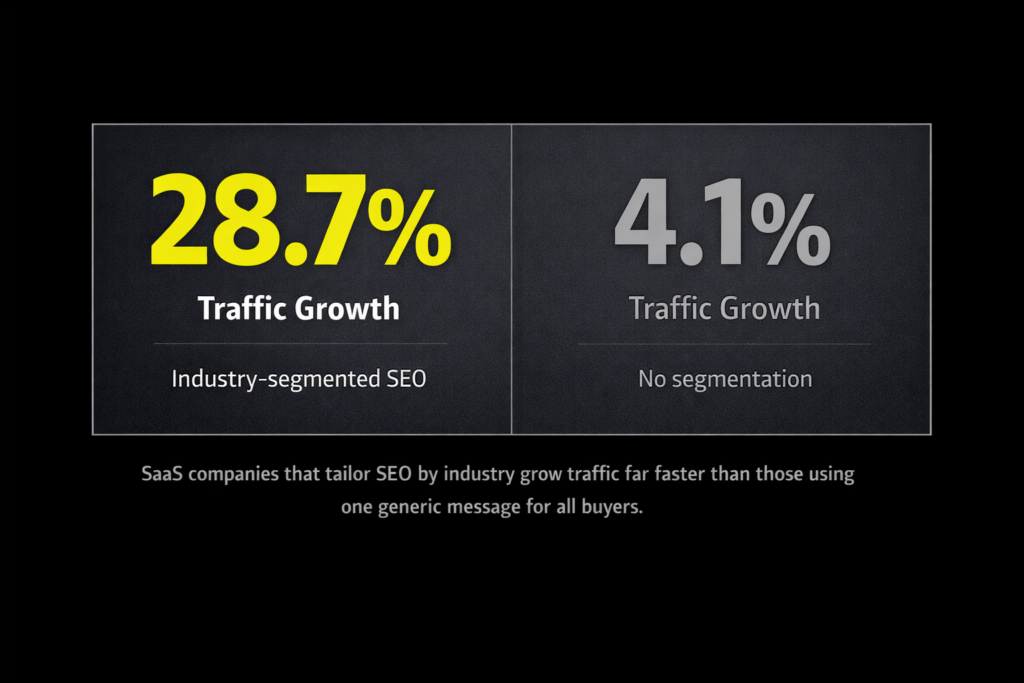
- B2B SaaS companies that segment customers by industry see 28.7% traffic growth vs. 4.1% without segmentation.
- 91% of B2B buyers prefer purchasing online.
- Organic search drives 44.6% of SaaS revenue.
- 30% of B2B companies prioritise SEO, making it the second most popular marketing investment.
- Only 5% of pages maintain a top‑ten ranking for more than one year. (Poweredbysearch)
- 91% of marketers say video marketing has delivered good ROI.
- 74% of marketers believe content marketing generates more demand and leads.
- 88% plan to maintain or increase SEO budgets.
- 79% of B2B marketers have a content marketing strategy.
- B2B companies investing more than $4,000 per post are 2.6× more likely to describe their strategy as very successful.
- SEO is the top marketing tactic for 49% of B2B marketers.
- 49% of B2B spending happens online.
B2B SEO Revenue Impact by Channel
- Organic search generates 44.6% of B2B revenue.
- Video marketing is among the top revenue‑generating formats.
- 70% of marketers say SEO produces more sales than PPC.
- 16% of marketers say SEO delivers the highest ROI, tied with social media.
- 56% of B2B marketers struggle to attribute ROI to content marketing.
- Businesses generate 2× more revenue from search engine optimisation than from any other channel.
- 49% of marketers report more sales or purchases due to content.
- The average SEO conversion rate is 3.75%, outpacing display ads (1.77%). (First Page)
- In professional services, paid search conversions average 7.0%, while email conversions reach 5.1%. (Ruler)
- Finance firms see 6.0% conversion from paid search and 7.1% from referral traffic. (Ruler)
- Industrial companies achieve 8.5% organic conversion and 7.4% email conversion. (Ruler)
- Travel companies achieve 9.5% conversion from referrals and 3.5% from organic search. (Ruler)
- Automotive brands convert at 2.9% via social media and 0.8% via email. (Ruler)
Regional B2B SEO Breakdown
United States and global market share
- In the U.S., Google holds 84.9% of the B2B search engine market.
- Bing’s U.S. desktop market share is 17.2%, up 3.1% in 2025. (Up Lead)
- Google’s mobile search share in the U.S. is 95.4%. (Up Lead)
- ChatGPT owns 3.2% of the U.S. search market and its market share grew 14%. (Seoprofy)
- Globally, 74% of B2B buyers search online before making a purchase. (Seoprofy)
- 76% of B2B website traffic is from search engines.
- 37% of buyers prefer to purchase through a supplier’s website.
- 63% of people directly visit websites for information.
- 67% of B2B buyers start their purchase journeys online.
- 76% of B2B buyers say content influences their final decision. (Seoprofy)
- 91% of B2B buyers prefer to purchase online.
- 53% of B2B website visits come from unpaid Google search results.
- Only 37% of B2B buyers prefer to use a supplier’s website for purchasing.
- 63% of B2B buyers visit websites directly to get information.
Local and Mobile Behavior: B2B SEO Stats
- 46% of Google searches seek local information. (Exploding Topics)
- 50% of “near me” searches result in a store visit within five miles. (Up Lead)
- 87% of users researched a local business on Google in the past year. (Up Lead)
- 47% of small business owners perform all marketing functions themselves. (Up Lead)
- 47% of keywords rank differently on mobile vs. desktop. (First Page)
- First‑position organic listings get 27% click‑through rate on mobile and 19.3% on desktop. (First Page)
- 59% of internet traffic originates from mobile devices. (Exploding Topics)
- 29% of buyers struggle with mobile ordering on B2B sites.
- 71% of B2B buyers want an improved mobile experience.
- 63% of people use mobile to research brands and products.
- By 2025, 72.6% of internet users will access the web exclusively through mobile.
B2B SEO Budget Leaders and Big Wins
- 55% of marketers invest more than $20k per month in enterprise SEO. (First Page)
- 81% of companies anticipate paying >$7,500 monthly for SEO. (First Page)
- The global digital advertising market share for Google is 70%. (Exploding Topics)
- Google’s ad revenue exceeded $300 billion in 2023. (Up Lead)
- SEO generates twice as much revenue as any other marketing channel.
- 36% of budgets are directed at lead generation. (Seoprofy)
- 52% of budgets will increase for thought‑leadership content. (Seoprofy)
- 61% of companies expect to increase video investment. (Seoprofy)
- 46% of B2B marketers plan to increase content marketing budgets in 2025.
- 92% of marketers intend to maintain or increase brand‑awareness investments.
- 88% plan to maintain or increase search budgets.
- 43% plan to raise their B2B content marketing budget next year.
- 61% expect to increase investment in video, 52% in thought leadership, and 40% in AI for optimisation.
B2B SEO Traffic and ROI Highlights
- Companies publishing blogs produce 67% more leads. (Seoprofy)
- High‑quality thought leadership content influences 79% of RFP decisions. (Ahrefs)
- B2B companies delivering strong thought leadership are 51% more likely to win C‑suite approval. (Ahrefs)
- Decision makers say 95% of strong thought leadership makes them receptive to vendors. (Ahrefs)
- Pages with video content have 84% higher dwell time.
- Short‑form video has the highest ROI for 21% of marketers. (Seoprofy)
- Video marketing provides good ROI for 93% of marketers.
- 96% of video marketers say videos increase brand awareness.
- 58% of marketers agree video delivers the best results for B2B companies.
- 55% of B2B buyers find video the most helpful content type.
- 91% of marketers say video marketing ROI is positive.
- Content marketing costs 62% less than traditional marketing and generates 3× more leads.
- Companies that produce original research see 29.7% traffic growth vs. 9.3% for those that do not.
- Sites offering free online tools experience 35.6% year‑over‑year growth in organic traffic.
- Segmented SaaS websites realise 28.7% average traffic growth.
- Websites publishing nine or more posts monthly see 35.8% growth.
- Long‑form content earns 77.2% more backlinks. (Poweredbysearch)
- Title tags of 40–60 characters deliver the highest click‑through rates. (Poweredbysearch)
- Positive headlines improve click‑through rates by 4.1%. (Poweredbysearch)
B2B SEO Cost and Recovery Patterns
Cost per lead and acquisition metrics
- Organic search leads cost $147, while paid search leads cost $280. (Ahrefs)
- The average cost of a high‑quality guest post ranges $692–$957. (Ahrefs)
- AI‑generated content is 4.7× cheaper to produce than traditional methods. (Ahrefs)
- AI tools cost companies $188 per month on average. (Ahrefs)
- Technical SEO ROI is 117% with a 6‑month payback period. (Up Lead)
- B2B SaaS SEO yields 702% ROI with 7 months to break even.
- Across all industries, SEO returns 825% on average. (Revenuezen)
- 88% of marketers plan to maintain or increase SEO budgets. (Up Lead)
- Marketing attribution provides efficiency gains of 15–30%. (Ruler)
- Businesses using AI note cost savings and efficiency for 54% of projects. (Up Lead)
B2B SEO Recovery Timelines & Performance Improvements
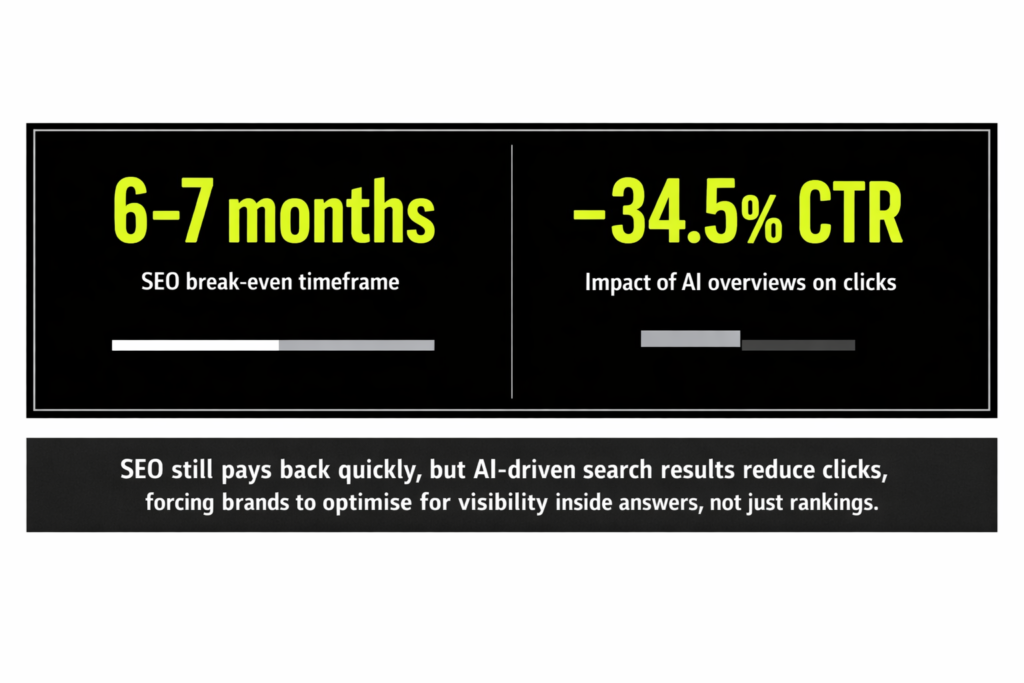
- B2B companies investing heavily in SEO report break‑even within 6–7 months. (Up Lead)
- AI overviews cut click‑through rates by 34.5%, requiring new optimisation strategies. (Ahrefs)
- 70% of marketers view SEO as more effective for driving sales than PPC.
- Internal linking increases site traffic by 37.1%. (Seoprofy)
- Schema markup is used on 78% of websites. (Ahrefs)
- Passing Core Web Vitals metrics is achieved by only 40% of websites. (Ahrefs)
- Generative AI helps identify 95% more long‑tail keywords than manual research. (Poweredbysearch)
- AI chatbots are predicted to replace traditional search for 55% of businesses. (Poweredbysearch)
- 62% of marketers see better SERP rankings by using AI tools. (Poweredbysearch)
- AI reduces content‑production time and increases publication frequency by 42%. (Ahrefs)
B2B SEO Human Impact on Marketing and IT Teams
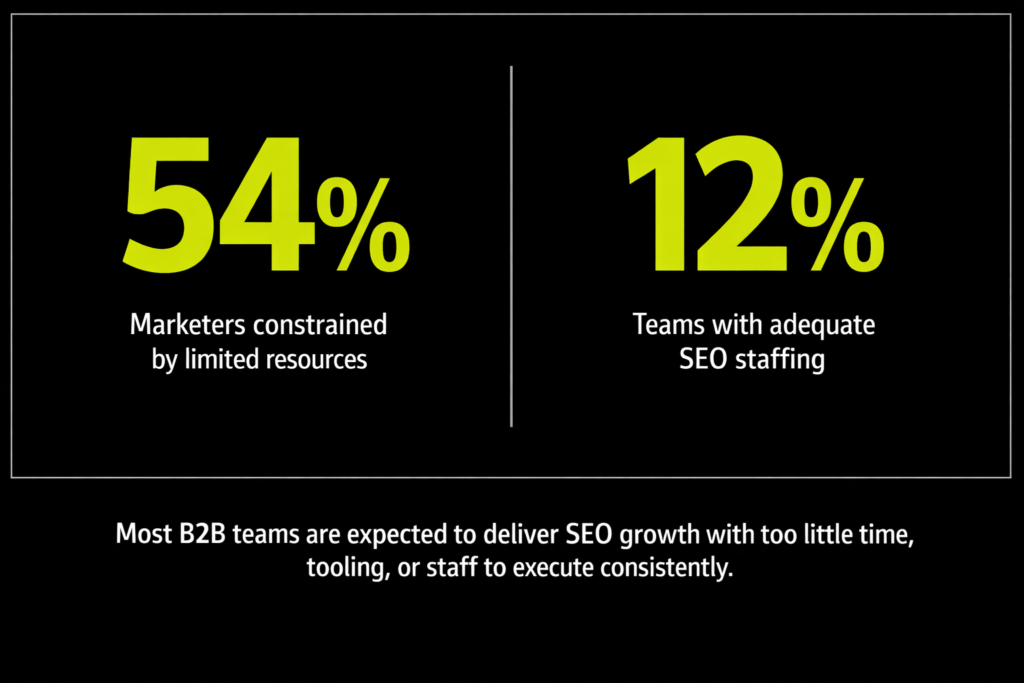
- 54% of B2B marketers cite limited resources as their biggest challenge. (Seoprofy)
- 56% of marketers believe technical SEO is undervalued. (Up Lead)
- 40% of B2B firms lack internal technical SEO expertise. (Ahrefs)
- 61% of B2B buyers say they have less time than last year for research. (First Page)
- 51% of small companies assign multiple content responsibilities to a single person vs. 30% of large companies. (Up Lead)
- 70% of brands outsource link building. (Revenuezen)
- 41% of digital marketers see link building as the hardest SEO task. (Revenuezen)
- 61% of SEO specialists say technical optimisation is the most effective strategy. (First Page)
- 81% of SEO pros send clients regular reports (often monthly). (Poweredbysearch)
- Only 12% of SEO professionals feel they have adequate staffing. (Seoprofy)
- 90% of B2B companies report that resource constraints slow down their content programs. (Seoprofy)
- 33% of marketers cite limited access to advanced analytics as a challenge. (Seoprofy)
- 51.8% of senior leaders consider data utilisation the second biggest challenge. (Seoprofy)
- 53% of organisations struggle to track live‑chat conversions. (Ruler)
- 62% fail to attribute revenue to inbound calls. (Ruler)
- 70% of businesses struggle to act on attribution insights. (Ruler)
- 42% of marketers manually report using spreadsheets. (Ruler)
- 39% carry out attribution for most marketing activities (up from 31% the previous year). (Ruler)
- 28% cannot view digital channel performance due to data silos. (Ruler)
- 59.6% rank generating quality leads as the top marketing challenge. (Ruler)
- 53.3% say minimal understanding of attribution models is the biggest challenge. (Ruler)
- 100% of marketers report difficulty tracking TV or radio ads. (Ruler)
- 33.1% increase in TV ad spending is anticipated, reaching $2.85 billion. (Ruler)
B2B SEO Timeline Shifts and Future Outlook
- B2B buyers consult 10 channels during research in 2025, up from 5 in 2016. (Ahrefs)
- Buyer shortlists shrank from 4–7 vendors to 1–3 vendors. (Ahrefs)
- The typical buying cycle spans 11.5 months. (Ahrefs)
- 81% of buyers have a preferred vendor after the first outreach. (Ahrefs)
- 73% of B2B marketers say sales cycles are getting longer. (Seoprofy)
- 71% of buyers choose the first vendor that satisfies their needs. (Ahrefs)
- 3–7 pieces of content are consumed before buyers speak to sales. (Revenuezen)
- 68% of all online experiences start with search and 53.3% of traffic comes from organic search. (Revenuezen)
- B2B buyers spend 27% of the buying journey on research. (Backlinko)
- Buyers spend 27% of their time on online research and 18% meeting potential suppliers (Backlinko) (including vendor websites and content).
- Only 5% of customers are actively “in market” at a given time. (Ahrefs)
- 91% of B2B buyers prefer purchasing online.
- 88% of buyers use mobile at work. (Revenuezen)
- 71% of B2B buyers want improved mobile experiences.
- 54% of marketers plan to use AI for automation tasks.
- 39% intend to invest in AI to improve content.
- 54.5% of businesses will increase spending on content marketing.
- 46% plan to increase content marketing budgets and 61% expect higher video investments.
- 92% plan to maintain or grow brand awareness budgets.
- 88% intend to maintain or increase search‑related budgets.
- 40% of B2B companies lack in‑house technical SEO expertise, forcing reliance on agencies. (Ahrefs)
- 78% of websites use schema; Core Web Vitals compliance remains low at 40%. (Ahrefs)
- Only 72% of SEOs currently use AI tools. (Revenuezen)
- 65% of businesses using AI see better results. (Revenuezen)
Sources
This article cites data from the following organisations and reports, including but not limited to:
- Ahrefs – 43 B2B SEO Statistics for 2025. (Ahrefs)
- RevenueZen – 148 Actionable B2B SEO Statistics for 2025. (Revenuezen)
- Exploding Topics – 130 SEO Statistics Every Marketer Must Know in 2025. (Exploding Topics)
- UpLead – 42 B2B SEO Statistics to Know in 2025. (Up Lead)
- First Page Sage – B2B SEO Statistics Report and Conversion Rate Benchmarks (First Page), (First Page)
- Ruler Analytics – 25+ Marketing Attribution Statistics. (Ruler)
- SEOProfy – Top 74 B2B Marketing Statistics in 2025. (Seoprofy)
- SEOProfy – 71 B2B SEO Statistics for 2025.
- Backlinko – 10 B2B SEO Statistics. (Backlinko)
- Powered by Search – B2B SaaS SEO Statistics for 2025. (Poweredbysearch)
- BrightEdge – Traffic and ROI statistics.
- Content Marketing Institute (CMI) – B2B Content Marketing Reports.
- SageFrog – 2025 B2B Marketing Mix Report.
- DemandGen Report – B2B Buyer Preferences.
- StrataBeat – Research on original content and tools.
- Siege Media – Blog post budgeting and AI strategies.
- Isoline Communications – B2B buyer insights.
- Wyzowl – Video marketing statistics.
- HubSpot – State of Marketing Reports.
- DataBox – SEO vs PPC insights.
- Gitnux – B2B SEO statistics.
- Wpromote – B2B Marketing ROI survey.
- CNBC, Statista, VML and various marketing research firms.
https://shorturl.fm/dqZ9T
https://shorturl.fm/xAt3F